The Investor Diary Entry #107: February 16, 2026
In today’s investor diary, I moved from discussing my personal trading platform to actually applying it to a live example. The platform includes my philosophy, strategic objectives, methodology, and the trading plan. Instead of keeping it theoretical, I am now showing how I use it on real charts. The pair that caught my attention was EURAUD. Even though I decided not to trade due to low liquidity caused by bank holidays, I still updated my charts and performed my full Forex market structure analysis as part of my daily routine.
TL;DR
EURAUD currently shows mixed signals between the daily and 4-hour time frames. While market structure suggests potential downside, the RSI readings are not fully aligned. Because my rules require both the daily and 4-hour RSI to tell the same story, this is not a trading opportunity yet. The plan is to wait for alignment before considering any position.
Starting With the Calendar and Liquidity
Before I begin any session, I check the economic calendar. On this particular Monday, there were CAD and USD bank holidays. That usually means low liquidity, and low liquidity often leads to unreliable price movement. As part of my solid Forex trading plan, I avoid trading in such conditions unless there is a very clear opportunity. Discipline starts even before opening a position.
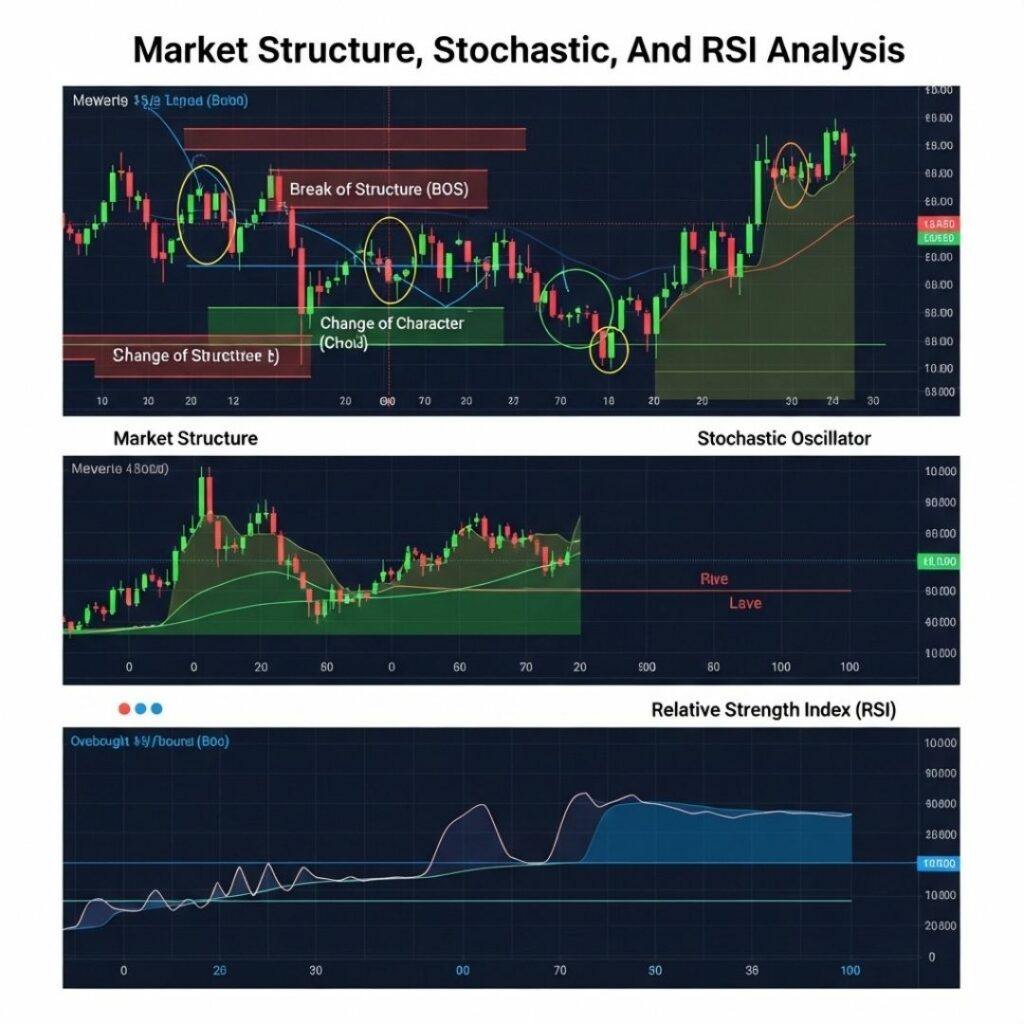
Daily and 4-Hour Market Structure
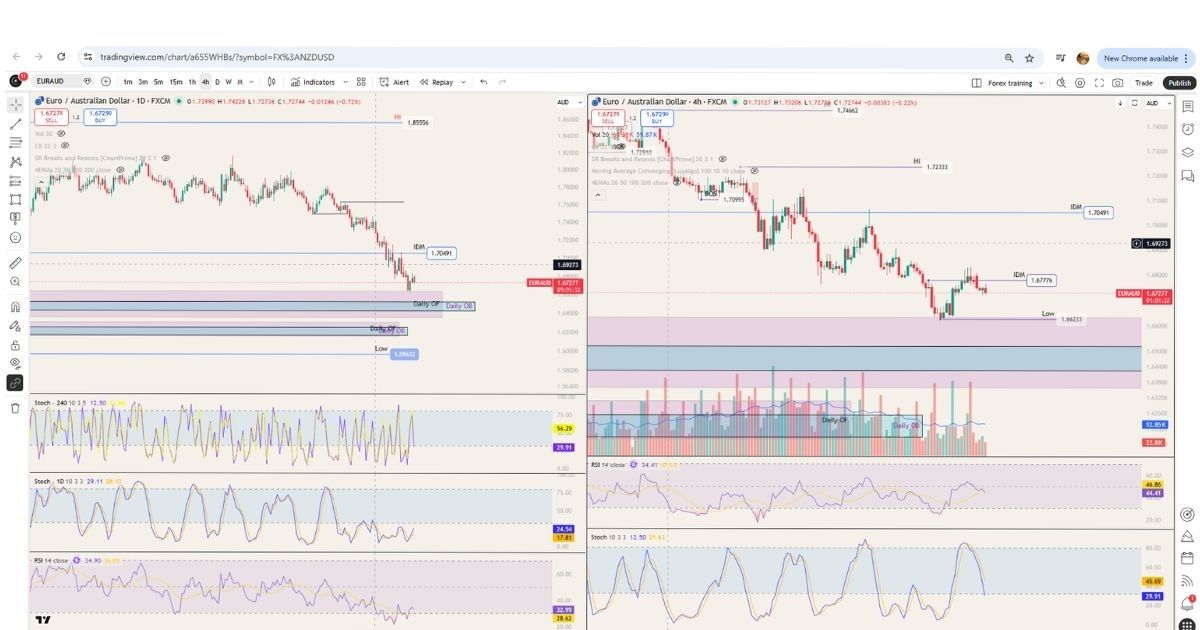
From a pure market structure perspective, EURAUD is trading within a defined range. On the daily time frame, price reacted from a decisional order flow. On the 4-hour chart, liquidity from the inducement was taken, and price started pushing lower.
If I only focused on structure, I could argue for a buy at certain levels, especially after a break of internal structure. However, structure alone is never enough in my process. My Forex market structure analysis is only the first layer. After that, I add momentum and confirmation tools.
At this stage, the daily suggests a reaction upward from order flow, while the 4-hour suggests potential continuation downward. That contradiction immediately tells me to slow down.
RSI Alignment as a Primary Filter
The first indicator I check after structure is the RSI. My rule is simple. For a buy, the RSI must be above 50 and above its moving average. For a sell, it should be below 50 and below its moving average, but not in an extreme oversold/overbought conditions.
On EURAUD, both the daily and the 4-hour RSI were below 50. That creates a bearish skew. However, there was still inconsistency in their positioning relative to the moving average, and the daily RSI was coming out of an oversold area. That creates uncertainty.
If the daily and 4-hour RSI do not say the same thing clearly, I move on. This is part of how to become a successful Forex trader, in my experience. You do not force trades when your main conditions are not satisfied.
Stochastic and Trend Context
Next, I review the stochastic on both time frames. The daily stochastic had flipped upward but was still below the lower bound, remaining in the sell area. The 4-hour stochastic was also pointing downward and nearing its lower boundary.
This creates a downward bias, but it is not strong enough by itself. If the daily stochastic pushes fully into the lower bound, the story might become clearer. Until then, it remains a developing situation.
I also check EMAs for trend alignment. On the daily chart, the EMAs are aligned in a sell direction. On the 4-hour chart, most EMAs support selling pressure, with only the 20 EMA slightly in the way of price. That is not strong enough to invalidate a potential sell, but it does not create urgency either.
Support, Resistance, and Clean Charts
I prefer to keep my charts clean. I do not display all indicators at once. I only bring them up when needed. On the 4-hour chart, there was no strong support blocking price if it continued downward.
The chandelier exit indicator also supported a sell scenario. However, confirmation tools only matter if the core conditions are met. Without RSI alignment, I do not proceed.
The 15-Minute Trigger
Once the daily and 4-hour analysis is complete, I drop to the 15-minute chart for execution. My trigger for a sell is clear. The 15-minute stochastic D line must cross below the 32 level. At that moment, I reassess the full picture.
However, I do not even reach this stage if my higher time frame conditions are not aligned. There is no need to update the 15-minute market structure if the daily and 4-hour RSI are not coherent. That saves time and protects focus.
FAQ
Why didn’t you take a trade on EURAUD?
Because the daily and 4-hour RSI were not fully aligned. My rules require both to tell the same story before I consider an entry.
Why is RSI alignment so important in your system?
It acts as a filter. If higher time frames disagree, the probability of a clean move decreases. Alignment reduces unnecessary trades.
What role does market structure play in your analysis?
Market structure defines the range, liquidity areas, and order blocks. It gives context, but it must be confirmed by momentum indicators.
How does this approach support a solid Forex trading plan?
It creates a checklist. I update structure, confirm RSI alignment, review stochastic and EMAs, and only then consider execution. Each step reduces impulsive decisions.
Conclusion
On EURAUD, the overall bias is skewing downward. The 4-hour structure suggests a possible break of the current range, and the daily may attempt to reach deeper liquidity within the order block. However, until the indicators align and tell one consistent story, there is nothing to do.
This example shows how I apply my trading platform in practice. A solid Forex trading plan is not about predicting every move. It is about waiting for alignment between structure, momentum, and confirmation. That patience is a core part of how to become a successful Forex trader.
The Investor
Monday 16 February 2026
About The Author
I started to look into individual stocks in January 2022. I created this diary initially for myself to track my investing progress, and second, as a place where I can share my ideas publicly, not only on stock investment, but on any venture that I start learning, such as Forex Trading, Blogging, or any other future venture that I might think of trying out.
By repeating things to myself, I learn by trying to explain them to others; therefore, I help myself better understand what I am learning. Additionally, hoping that others will share their ideas and learn from each other, and lastly as an online business where some links that I share are affiliate links, and if anybody bought anything by clicking those links, I will get a commission based on that successful sale, which of course will not affect the price at which you are buying the product or service.
For more detailed information on my affiliate disclosure, please refer to the Full Affiliate Disclosure page.
This blog is also part of my blogging learning project. I’m using a platform to learn this part. If you are interested in it, it is called Wealthy Affiliate.
Furthermore, this site is in no way or form giving any financial or investing advice, nor is it encouraging or discouraging people to buy or sell any financial instrument. This is a personal diary in which I track my own progress and share it for informational, educational, and entertainment purposes.