
The Investor Diary Entry #111: February 23, 2026
There were no open trades today and no positions met the criteria for entry. Instead of forcing activity, the focus remained on observation. The ongoing review of EURAUD continues to highlight how conflicting signals across timeframes challenge decision-making and reinforce the importance of discipline within a solid Forex trading plan.
TL;DR
EURAUD previously showed a daily buying reaction at order flow, while the 4-hour Forex market structure analysis suggested potential continuation downward. Weekly stochastic remains deeply positioned under 32, while RSI on both weekly and daily charts has been fluctuating around overbought territory. The 4-hour chart failed to break a key low, creating uncertainty. With price sitting in the middle of a downward range and no clear alignment across timeframes, there is no definite setup. Patience remains essential in building a solid Forex trading plan and understanding how to become a successful Forex trader.
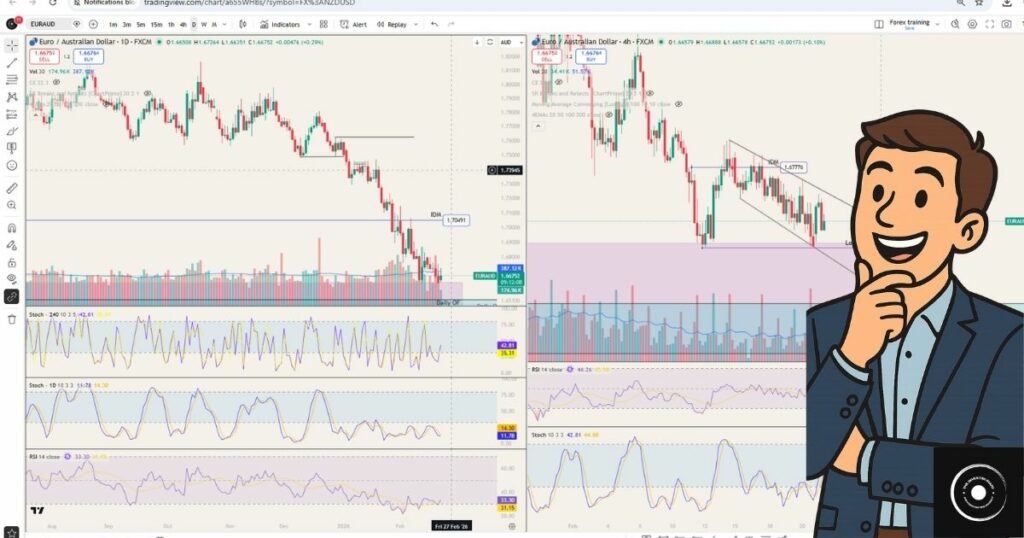
Daily Order Flow vs 4-Hour Forex Market Structure Analysis
Last week, the daily timeframe showed price touching the daily order flow around Monday the 16th. That reaction suggested a possible buying opportunity. From a higher timeframe perspective, the structure implied that price had reached an area where upward reaction could occur.
However, the 4-hour Forex market structure analysis told a different story. The structure indicated that liquidity was being grabbed and that price might continue downward. This contradiction between the daily and the 4-hour timeframe created hesitation.
When conducting Forex market structure analysis, alignment across timeframes is critical. In this case, the daily suggested reaction upward, while the 4-hour maintained pressure within a downward range. Without confirmation from both, the setup could not qualify under a solid Forex trading plan.
Weekly Stochastic, RSI, and Reaction Potential
Looking at the weekly timeframe, the stochastic has been under the 32 level for an extended period and continues moving deeper. That positioning reflects sustained downward pressure. At the same time, RSI on the weekly chart has been overbought, while the daily RSI has repeatedly moved in and out of overbought territory.
This combination creates tension. The stochastic suggests continuation downward, yet RSI behavior suggests that a reaction may occur before any further decline. The possibility of an upward reaction exists, especially considering the weekly context.
Still, possibility is not confirmation. In the process of learning how to become a successful Forex trader, distinguishing between possibility and probability is essential. A solid Forex trading plan requires defined conditions, not assumptions based on what might happen.
The Failed Break on the 4-Hour Chart
On the 4-hour timeframe, price approached a key low within the downward channel. The expectation was that liquidity would be taken and the range would break. Instead, price stopped just above the level and did not break it.
This reaction is unusual. If the downward move were strong, the break would likely have occurred. The failure to break raises the question of whether the market is preparing for an upward reaction.
At the same time, price currently sits in the middle of the 4-hour downward range. From a Forex market structure analysis perspective, the middle of a range offers little edge. It does not provide clear directional bias. Price could attempt another break lower and still remain within the broader channel.
Two daily bottoms also remain unbroken. If those lows continue to hold, upward reaction becomes more probable. If they fail, the downward channel continues.
Observation, Testing, and Trading Discipline
Beyond EURAUD, reflections on other pairs reinforced an important principle. The idea that price always comes back to a level is commonly repeated. However, when price returns, the surrounding circumstances may not be the same.
A level that was once a sell under one structure may become a buy under another. Context changes. Structure changes. Momentum changes.
Understanding this difference is part of how to become a successful Forex trader. It requires ongoing testing, observation, and journaling. The trading diary process supports that development by forcing structured reflection rather than emotional reaction.
Today, there was no definite opportunity. According to the guiding rule, if the opportunity is not a definite yes, then it is a no. This rule protects capital and maintains consistency within a solid Forex trading plan.
FAQ
Why was no trade taken on EURAUD?
There was no alignment between daily order flow, weekly indicators, and 4-hour Forex market structure analysis. Without confirmation across timeframes, the setup did not qualify.
What does the weekly stochastic indicate?
It remains deeply positioned under 32, reflecting ongoing downward pressure, although RSI behavior introduces the potential for reaction.
Why is the 4-hour failed break significant?
Price approached a key low but did not break it. This creates uncertainty about whether the downward channel will continue or whether an upward reaction may develop.
How does this relate to building consistency?
Consistency comes from applying rules strictly. Waiting for confirmation and avoiding unclear setups is central to a solid Forex trading plan and to understanding how to become a successful Forex trader.
Conclusion
EURAUD remains structurally complex. The daily timeframe shows reaction potential, the 4-hour chart remains within a downward range, and weekly indicators present mixed pressure. Without alignment, there is no clear bias.
Patience, structured Forex market structure analysis, and disciplined execution remain the priority. Over time, this repeated process strengthens decision-making and contributes to building a solid Forex trading plan grounded in observation rather than impulse..
The Investor
Monday 23 February 2026
About The Author
I started to look into individual stocks in January 2022. I created this diary initially for myself to track my investing progress, and second, as a place where I can share my ideas publicly, not only on stock investment, but on any venture that I start learning, such as Forex Trading, Blogging, or any other future venture that I might think of trying out.
By repeating things to myself, I learn by trying to explain them to others; therefore, I help myself better understand what I am learning. Additionally, hoping that others will share their ideas and learn from each other, and lastly as an online business where some links that I share are affiliate links, and if anybody bought anything by clicking those links, I will get a commission based on that successful sale, which of course will not affect the price at which you are buying the product or service.
For more detailed information on my affiliate disclosure, please refer to the Full Affiliate Disclosure page.
This blog is also part of my blogging learning project. I’m using a platform to learn this part. If you are interested in it, it is called Wealthy Affiliate.
Furthermore, this site is in no way or form giving any financial or investing advice, nor is it encouraging or discouraging people to buy or sell any financial instrument. This is a personal diary in which I track my own progress and share it for informational, educational, and entertainment purposes.