The Investor Diary Entry #122: April 13, 2026
Analyzing the Forex market means making sense of currency price movements and spotting good trading opportunities. I rely on two main strategies: the fundamental and technical approach. Both have their place, and getting comfortable with them can really help you make smarter choices, whether you’re just starting out or looking to sharpen your edge as a trader.
TL;DR:
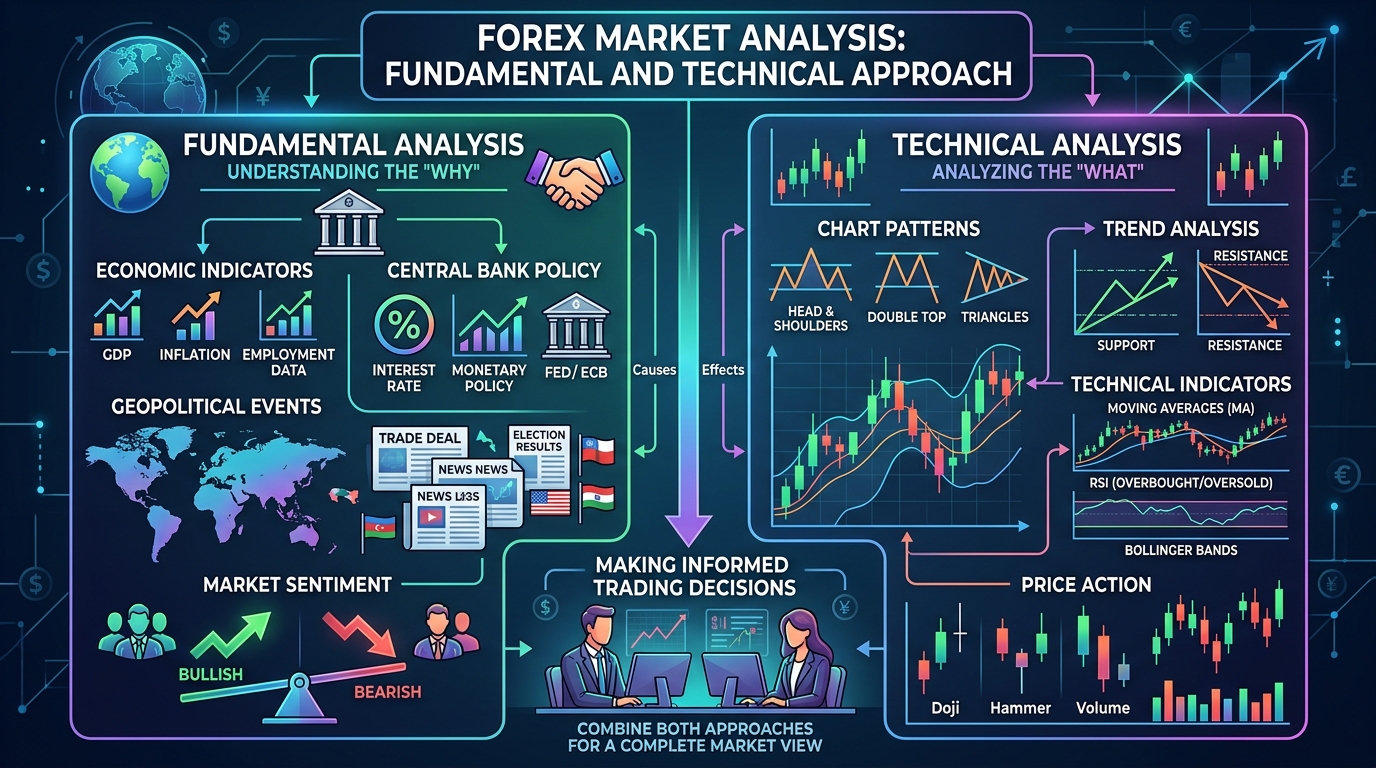
Forex market analysis usually relies on a fundamental and technical approach. The fundamental approach looks at economic news and indicators that influence the value of currencies, like GDP, interest rates, and employment data. Technical analysis focuses on chart patterns, indicators, and price trends to predict future movements. Combining both methods can offer a broader perspective and potentially improve your trading outcomes.
Understanding the Two Approaches in Forex Market Analysis
Every Forex trader faces the decision between fundamental analysis, technical analysis, or a combination of both. I find it really helpful to start by knowing what each strategy covers and how it works.
Fundamental analysis is all about checking in on the overall health of economies. It means watching financial news, policy decisions, and bigger macroeconomic trends. You’re basically looking for news or reports that could shake up currency prices in a big way, both short- and long-term. For example, things like surprise central bank policy changes or major government decisions often impact entire currency pairs.
Technical analysis leans on historical price data and chart patterns. With this method, you’re spotting trends, reversals, or repeating setups—these give clues about where prices could be headed next. Technical traders don’t focus on what the news says, but instead make decisions based on what price movements are showing them.
Once you get used to both, you’ll find more flexibility and be able to fit your style to changing market conditions. Traders can switch up their approach as the market evolves, giving themselves more tools to work with, no matter what’s happening in the world economy.
What Is Fundamental Analysis in Forex?
Fundamental analysis boils down to digging into the underlying factors that affect currency values. Usually, this means staying up to date with economic news and official government or central bank reports. Here are some major elements I always watch for:
- Interest Rates: Set by central banks, changes here make currency prices move right away.
- Gross Domestic Product (GDP): A rising GDP signals a strong economy, boosting confidence in a country’s currency and often bringing foreign investment into the picture.
- Employment Figures: Reports like the U.S. Non-Farm Payroll can make markets swing wildly if the data is much better or worse than expected.
- Inflation Data: Consumer price indexes show how fast prices are rising; this impacts central bank decisions and can sway currency markets quickly.
- Political Events: Elections, government crises, or big policy statements can all ripple through markets almost instantly.
I always keep an economic calendar handy so I don’t miss major headlines and unexpected events. These can set up the direction for price movements for a whole session, day, or even week, so it pays to stay ahead.
Technical Analysis: Reading the Charts and Tools
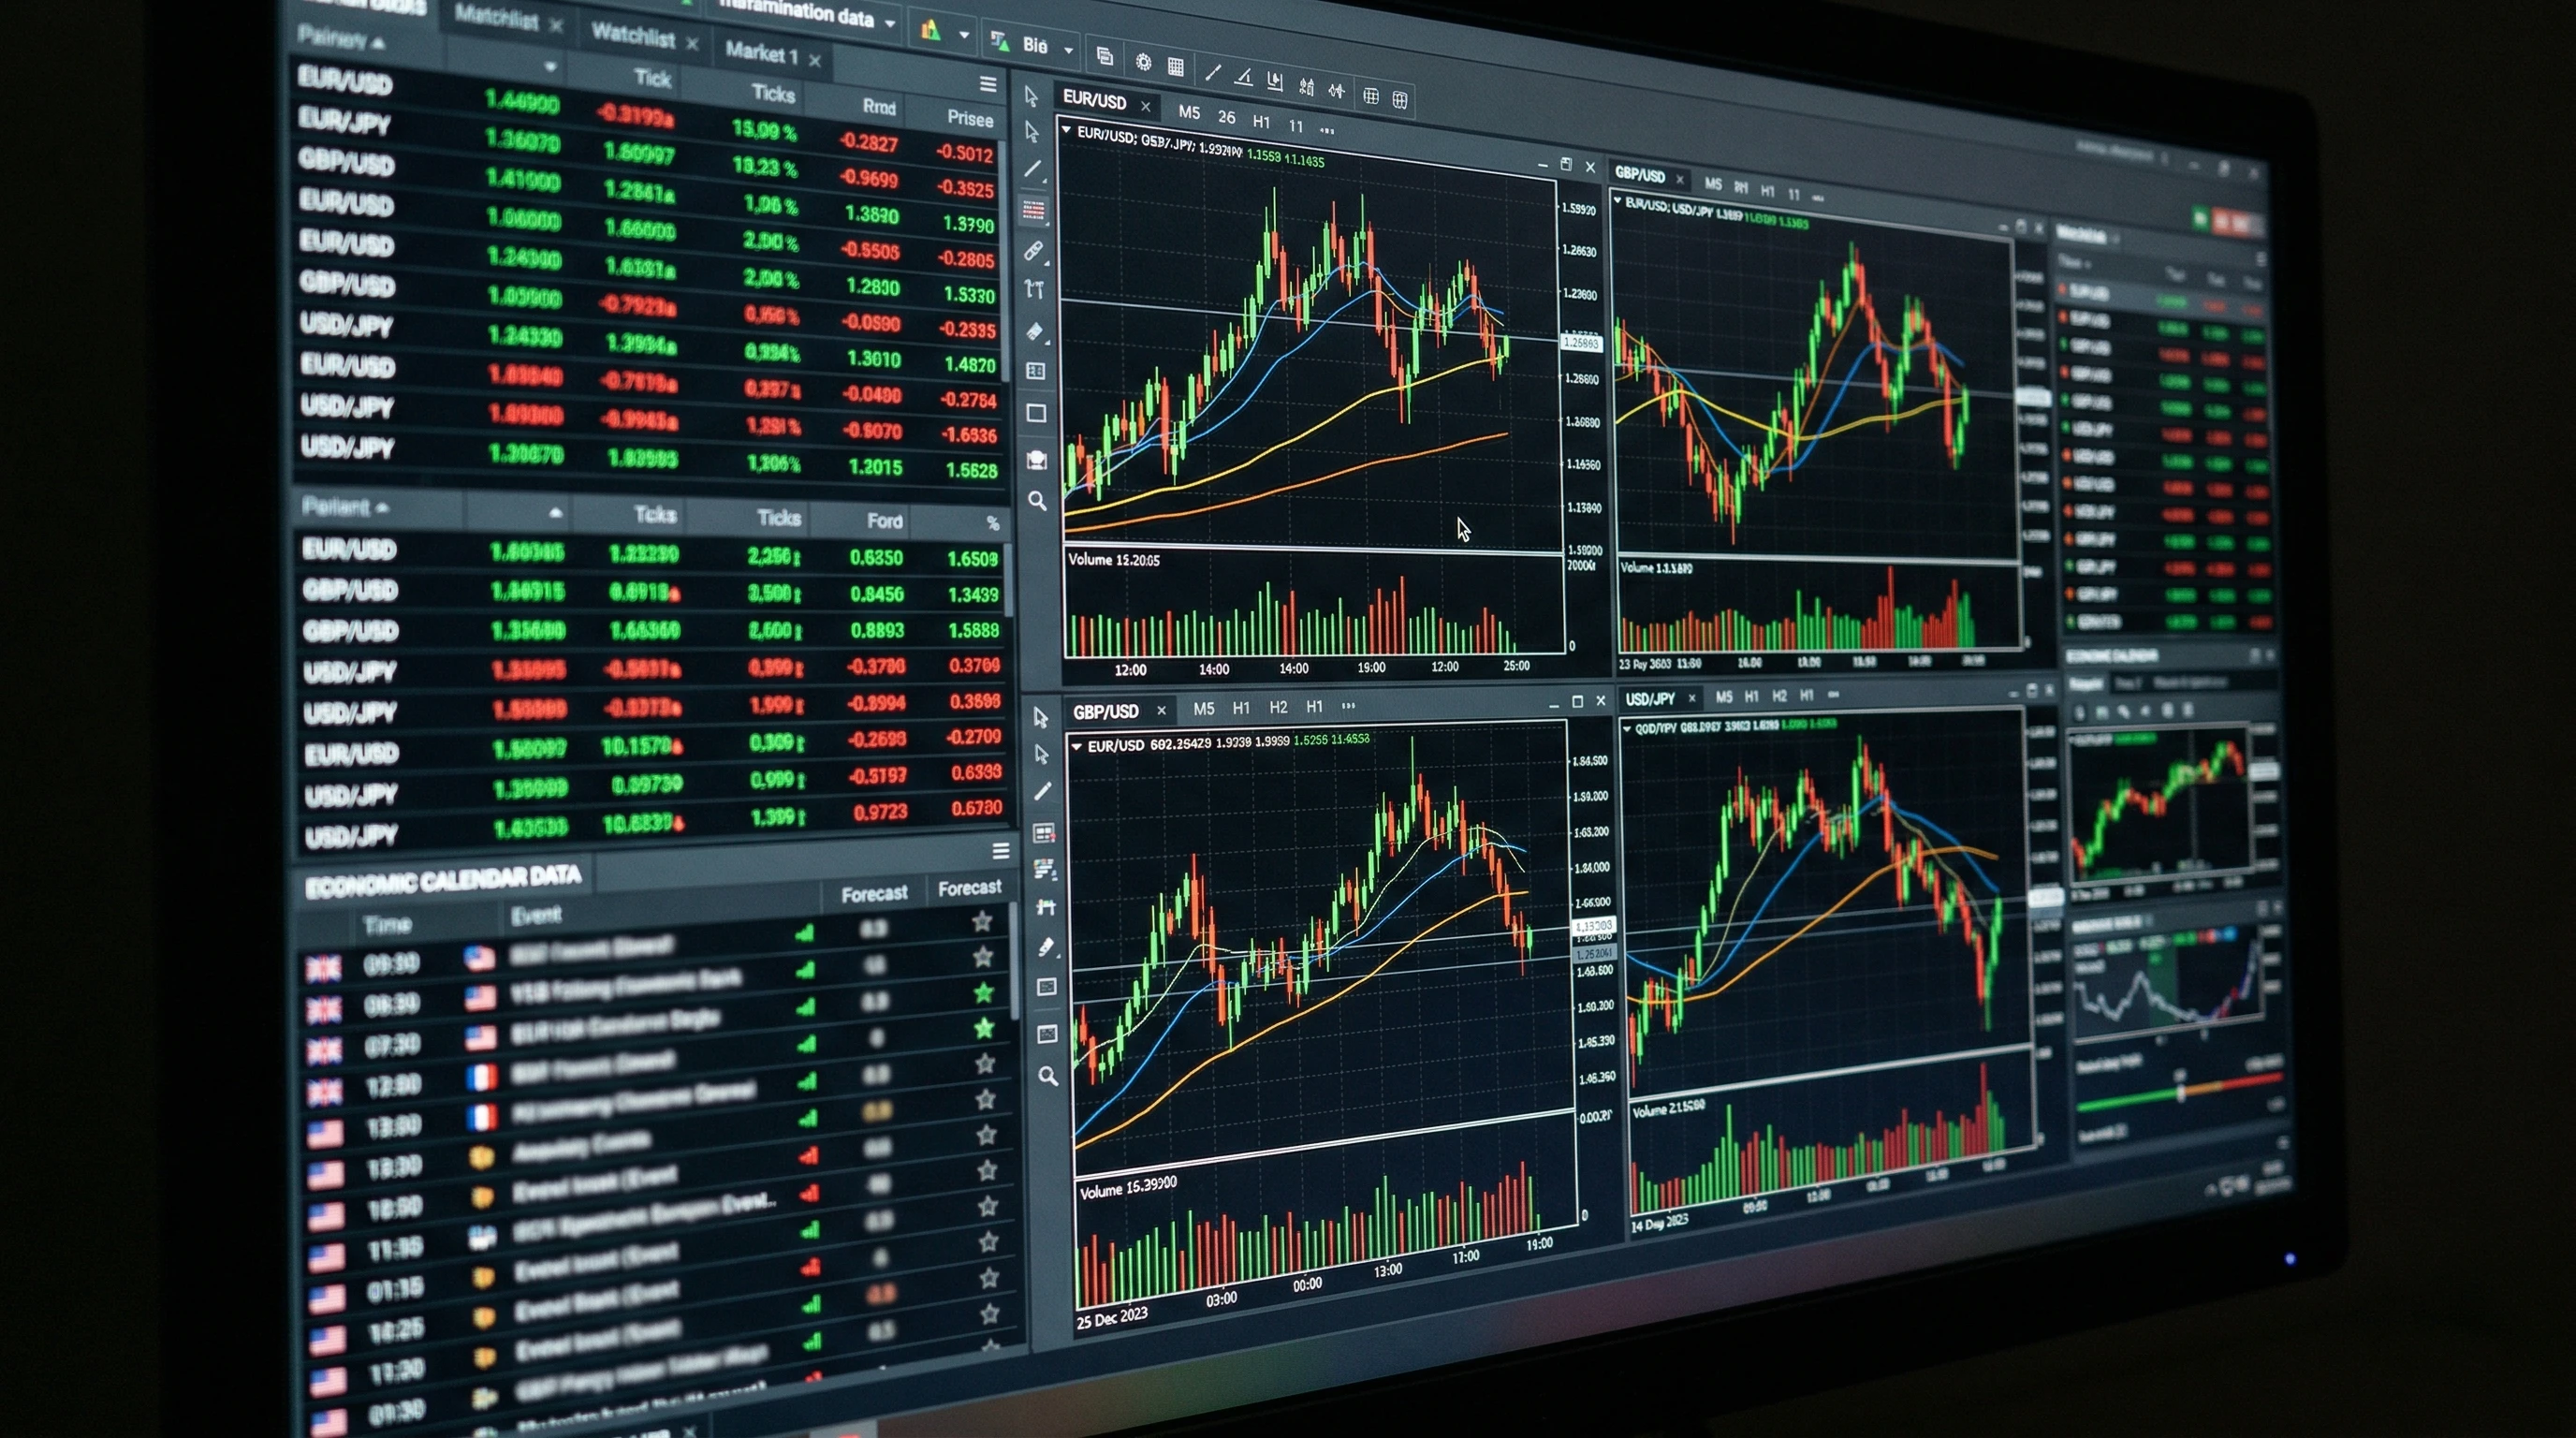
Technical analysis is about getting into price charts, looking for signals, and crunching numbers to make sense of market structure. This approach stays away from news and looks at real price action. It’s a way to spot what traders are actually doing, not just what they say.
Some key tools and terms that come up again and again:
- Support and Resistance Levels: These are zones where prices often pause, pull back, or turn around. They can help you choose smart entry and exit points.
- Trend Lines: Lines that show if the market is moving up, down, or sideways over a certain time period. Spotting a clear trend can help you ride momentum.
- Chart Patterns: Shapes like head and shoulders, double tops, or triangles might hint at a reversal or signal that a trend could keep going.
- Indicators: Formulas such as RSI, MACD, and moving averages get applied to the price chart. These indicators can point to when it’s wise to buy or sell.
- Market Structure in Forex Trading Analysis is a key way to spot trends, periods of consolidation, and when major moves are about to start.
Technical analysis simplifies things if you stick to the basics and avoid loading up your screen with too many indicators. Sometimes, a clean chart with clear trend lines and key levels is all you need to make a smart trading plan.
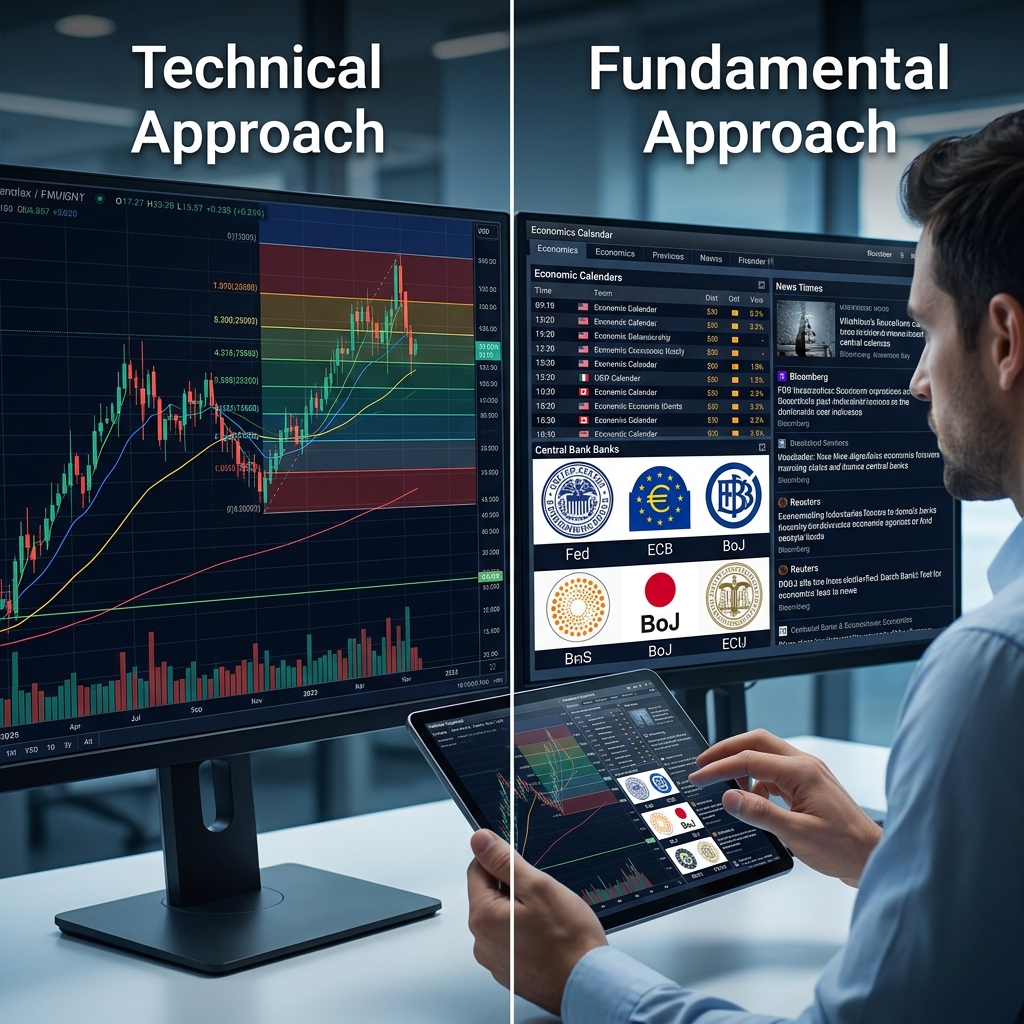
Combining Fundamental and Technical Analysis
Mixing both approaches can offer a broader picture and potentially lead to better results. I often use fundamental analysis to choose which currency pairs get my attention, especially during big news releases. Then, I dig into the charts for my entry and exit points.
For instance, when the eurozone reports strong, unexpected GDP growth (a fundamental signal), and the EUR/USD currency pair is bouncing up from a support area at the same time (a technical signal), that’s a green light to look deeper. Both signals line up, so the trade looks stronger. Rather than picking a side between the two approaches, I find combining them adds confidence and can filter out less reliable trades.
Key Steps for Effective Forex Market Analysis
Breaking trading down into practical steps makes the routine clearer and easier to stick to under pressure:
- Stay Informed: Always check economic calendars for the day’s headline announcements, news releases, and potential market movers.
- Review Charts: Read the charts for clear trends, chart patterns, and signals that the market is moving or primed for a change.
- Watch News Reactions: Notice how prices respond to major headlines—sometimes the market moves even before the official news is out.
- Define Entry and Exit: Use your chart setup and the latest news to pick the best spots for getting in and out of trades, rather than guessing.
- Apply Risk Management: Never risk more than you can afford on a single trade. Here’s a helpful guide on how to learn risk management in Forex Trading to keep your account safe over the long haul.
Stick with these steps. They’ll help make each trade more of an informed choice and less of a wild guess, especially in a fast-moving market.
Common Challenges and How to Handle Them
In my experience, lots of beginners hit roadblocks with both strategies. Below are common issues and some actionable ideas for getting past them:
Fundamental Overwhelm
Too much news and too many reports can get overwhelming fast. To keep things in check, I focus mostly on high-impact items—central bank news, jobs reports, inflation readings—and tune out smaller headlines that rarely move prices. This way, I avoid wasting time on noise and only respond to developments that actually matter.
Technical Confusion
Many new traders are tempted to turn their charts into a rainbow by piling on every indicator they find. In reality, this just adds clutter. Sticking with basics like moving averages, support/resistance, and one or two favorite indicators keeps things much clearer and less stressful.
Emotional Trading
Forex can be fast-paced, and emotional reactions lead to mistakes. Having a trading plan before big events—and sticking to strict risk rules—keeps those knee-jerk trades in check. Honestly, the best traders are the ones who keep their cool when things speed up.
Real-World Example: Using Both Approaches Together
Last year provided a great example when the U.S. Federal Reserve was expected to raise interest rates. Hours before the decision, the USD started climbing against less strong currencies. When the rate hike was confirmed, the USDJPY chart made a pullback to a moving average support level—right in line with news expectations. Jumping in at this spot and putting a stop loss below recent lows would work out well, because both kinds of analysis pointed in the same direction.
Frequently Asked Questions
Here are a few questions I often hear from traders who are looking to analyze the Forex market:
Question: Should I use fundamental or technical analysis for Forex trading?
Answer: Both styles offer something useful. Technical analysis is usually a bit easier for beginners, while fundamental analysis gets more valuable as you learn to read economic and news reports. Combining both typically gives you the fullest picture.
Question: What are some important economic indicators for fundamental analysis?
Answer: Key indicators include interest rate changes, GDP growth, employment statistics, inflation numbers, and political events. These tend to have the biggest and fastest effects on Forex prices.
Question: How do I pick the right technical analysis tools?
Answer: Keep it simple to start. Tools like moving averages, RSI, and watching for price action work for most setups. Later on, you can branch out, but too many tools just make trading confusing and lead to second-guessing.
Question: How can I improve my risk management in Forex trading?
Answer: Don’t risk more than you can handle per trade. It’s a must. Use stop losses and manage your position size carefully. For more practical suggestions, check out this guide on risk management in Forex Trading.
Wrapping Up
Getting the hang of Forex market analysis through both fundamental and technical strategies opens up smarter, more informed trading opportunities. By staying on top of big economic events and reading the charts, you get a well-rounded view—one that can boost your results and help you grow as a trader. Building practical experience with both approaches keeps you adaptable in any market and adds some excitement to your trading adventure.
The Investor
Monday 13 April 2026
About The Author
I started to look into individual stocks in January 2022. I created this diary initially for myself to track my investing progress, and second, as a place where I can share my ideas publicly, not only on stock investment, but on any venture that I start learning, such as Forex Trading, Blogging, or any other future venture that I might think of trying out.
By repeating things to myself, I learn by trying to explain them to others; therefore, I help myself better understand what I am learning. Additionally, hoping that others will share their ideas and learn from each other, and lastly as an online business where some links that I share are affiliate links, and if anybody bought anything by clicking those links, I will get a commission based on that successful sale, which of course will not affect the price at which you are buying the product or service.
For more detailed information on my affiliate disclosure, please refer to the Full Affiliate Disclosure page.
This blog is also part of my blogging learning project. I’m using a platform to learn this part. If you are interested in it, it is called Wealthy Affiliate.
Furthermore, this site is in no way or form giving any financial or investing advice, nor is it encouraging or discouraging people to buy or sell any financial instrument. This is a personal diary in which I track my own progress and share it for informational, educational, and entertainment purposes.