
The Investor Diary Entry #109: February 18, 2026
In today’s investor diary, I reviewed the GBPUSD short position I opened and evaluated how accurately I followed my personal trading platform. This platform is built on my trading philosophy, strategic objectives, methodology, and trading plan. After opening a sell position on USDJPY yesterday, which is currently going against me, I opened another sell on GBPUSD. Interestingly, both pairs signaled the same direction despite usually moving differently. This raised important questions about execution, discipline, and emotional influence.
TL;DR
I opened a GBPUSD short based on Forex market structure analysis, stochastic and RSI alignment, and liquidity targets. However, I ignored key rules from my solid Forex trading plan, including EMA positioning and the Chandelier Exit signal. The trade is currently under pressure, highlighting gaps in execution rather than flaws in methodology.
My Trading Philosophy and Framework
Before analyzing the trade itself, I reminded myself of my philosophy. I trade strictly within my methodology and according to plan. I trade for a maximum of three hours per session, although today’s session lasted around thirty minutes. GBPUSD was the second pair I reviewed, and after opening the position, I stopped trading. I avoid opening more than two trades under the current circumstances.
I am still trading on a demo account. I will not move to live trading until I can demonstrate consistent profitability using one methodology and a clear solid Forex trading plan.
There are two controversial elements in my philosophy. First, I trade without a stop-loss but monitor positions daily. Second, I am challenging myself to avoid losing trades altogether. I also target a daily return of 30 to 60 pips and avoid trading on Fridays.
The Selling Conditions
My sell conditions are structured and precise:
- Update daily and 4-hour market structures.
- Confirm reaction at a point of interest.
- Ensure the 15-minute stochastic D crosses below the 32 level.
- Confirm daily and 4-hour stochastic alignment downward.
- RSI on daily and 4-hour must be below 50 and below their moving averages.
- Chandelier Exit on both 15-minute and 4-hour must show sell signals.
- Review EMAs and support/resistance for confirmation.
- Target 50 pips if a POI is involved, otherwise 30 pips.
This is the foundation of my Forex Trading Plan within what I call my personal trading platform, which consists of my trading philosophy, strategic objectives, trading methodology, and trading plan.
Market Structure Perspective on GBPUSD
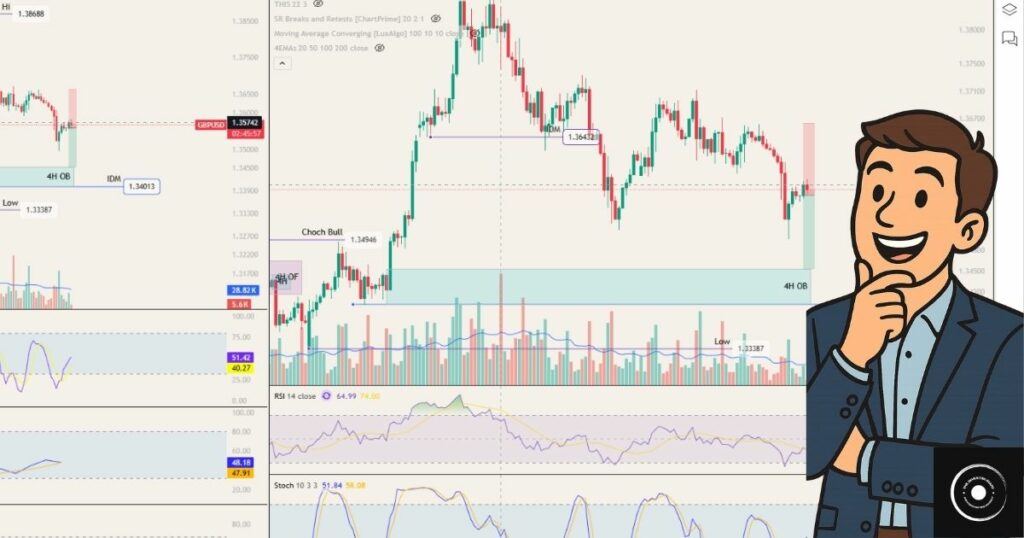
On the daily timeframe, price is moving down toward liquidity below an inducement level. On the 4-hour timeframe, there was a change of character to the upside, but structurally, price still needs to grab liquidity below. The idea behind the trade was that price would move down to capture that liquidity.
However, there was no clear reaction from a point of interest. According to my plan, trades with long take-profit distance should only be taken after such a reaction. This rule was not followed strictly. I suspect part of this decision may have been emotional, influenced by the negative movement in USDJPY. I may have been subconsciously looking for compensation.
RSI and Stochastic Alignment
The stochastic indicator showed a flip to the downside on the Daily timeframe. The daily RSI was below 50 and below its moving average. The 4-hour RSI was also below 50 at entry, although it later moved above its average, signaling upward pressure.
I chose to ignore the developing upward strength on the 4-hour because the daily structure and liquidity theory supported the downside. This reflects a common challenge in Forex market structure analysis: deciding which timeframe carries more weight.
EMA and Support Resistance Signals
Another issue emerged with the exponential moving averages. At entry, price was below the 4-hour 200 EMA, which was reassuring. Later, price moved above it, turning that level into potential support. According to my own rules, if EMAs interrupt price movement, the trade should be avoided. I did not fully respect that condition.
Support and resistance levels were present but not particularly strong. Volume analysis added another concern. Selling candles showed weak volume, while buying candles showed stronger participation. This contradicted the bearish expectation.
The Chandelier Exit Mistake
The biggest mistake was ignoring the Chandelier Exit signal on the 15-minute timeframe. My rule clearly states that both 15-minute and 4-hour Chandelier indicators must show a sell signal. After entering the trade, I realized the 15-minute indicator was still signaling a buy.
Had I checked it before execution, I would not have taken the trade. This highlights an execution failure, not a flaw in the system. Urgency replaced patience.
Lessons About Discipline
This experience connects directly to how to become a successful Forex trader. Success is not only about identifying setups. It is about consistent implementation. My methodology was clear, but my execution was inconsistent. I ignored the 4-hour stochastic, overlooked EMA positioning, and failed to confirm the Chandelier signal.
The system did not fail me. I failed to apply it completely.
FAQ
Why did you take the GBPUSD short despite mixed signals?
Because the daily structure suggested a move toward liquidity below inducement, and multiple indicators aligned bearish at entry. However, I ignored conflicting signals on the 4-hour timeframe.
Was this trade fully aligned with your trading plan?
No. The Chandelier Exit rule and EMA positioning rule were not properly respected.
Did emotions influence the decision?
Possibly. With USDJPY already negative, I may have been seeking compensation through GBPUSD.
What is the main takeaway from this trade?
Execution discipline matters more than analysis quality.
Conclusion
This GBPUSD short position was based on structured Forex market structure analysis supported by stochastic and RSI signals. The theory behind the trade was clear: price needed to capture liquidity below. However, the implementation exposed weaknesses in discipline.
If I want to understand how to become a successful Forex trader, I must focus on executing my solid Forex trading plan without selectively ignoring rules. Consistency in application is the real challenge. The market did not break my rules. I did.

The Investor
Wednesday 18 February 2026
About The Author
I started to look into individual stocks in January 2022. I created this diary initially for myself to track my investing progress, and second, as a place where I can share my ideas publicly, not only on stock investment, but on any venture that I start learning, such as Forex Trading, Blogging, or any other future venture that I might think of trying out.
By repeating things to myself, I learn by trying to explain them to others; therefore, I help myself better understand what I am learning. Additionally, hoping that others will share their ideas and learn from each other, and lastly as an online business where some links that I share are affiliate links, and if anybody bought anything by clicking those links, I will get a commission based on that successful sale, which of course will not affect the price at which you are buying the product or service.
For more detailed information on my affiliate disclosure, please refer to the Full Affiliate Disclosure page.
This blog is also part of my blogging learning project. I’m using a platform to learn this part. If you are interested in it, it is called Wealthy Affiliate.
Furthermore, this site is in no way or form giving any financial or investing advice, nor is it encouraging or discouraging people to buy or sell any financial instrument. This is a personal diary in which I track my own progress and share it for informational, educational, and entertainment purposes.