The Investor Diary Entry #132: April 29, 2026
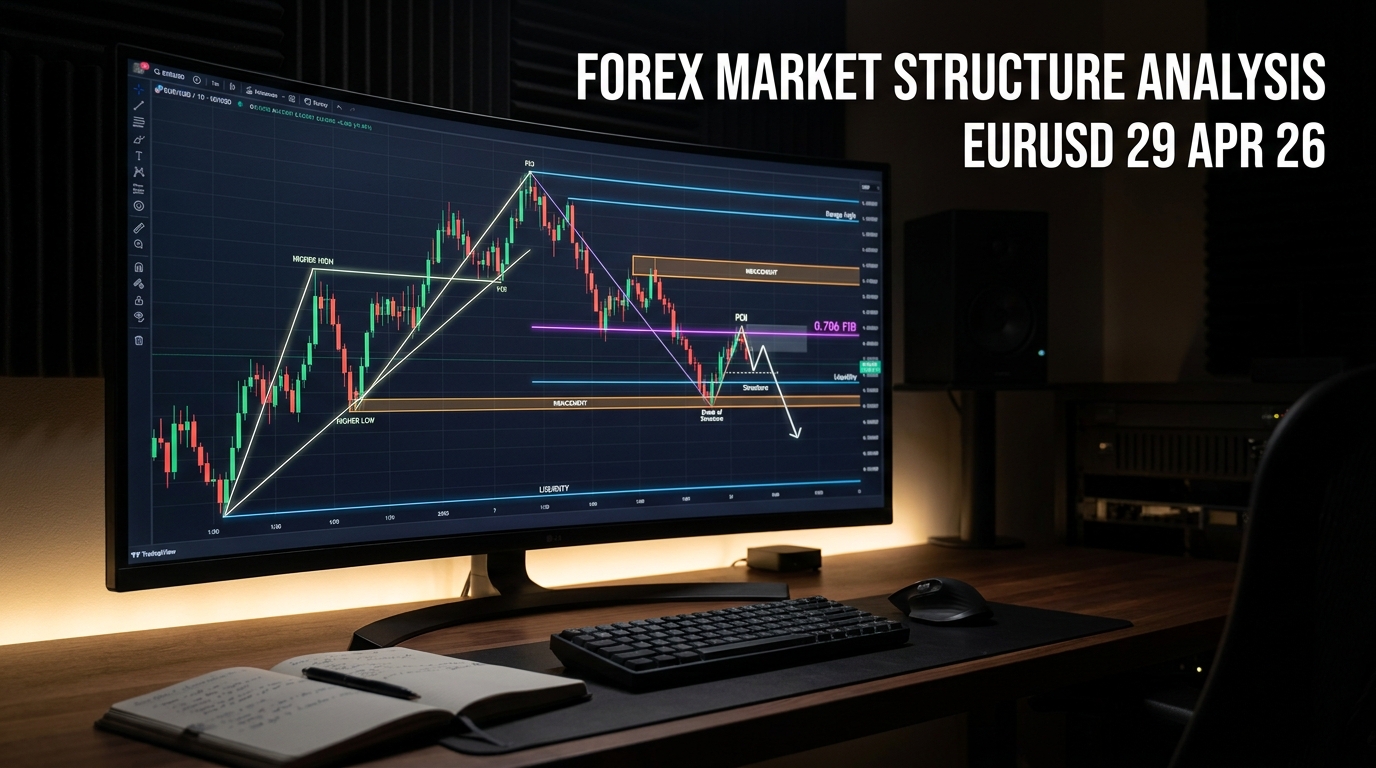
This week’s breakdown focuses on a full Forex market structure analysis of EUR/USD based entirely on real trades taken during the week. The process reflects a trading diary approach, where the focus is on applying a developing strategy using market structure and SMC elements. One trade resulted in a win, while the other ended in a loss, offering a balanced view of execution, decision-making, and ongoing refinement.
TL;DR
The EURUSD analysis begins with a higher timeframe bullish structure on the six-month and weekly charts. Despite this, price moves lower on the four-hour timeframe to capture liquidity, creating a counter-trend environment. One trade aligned with this liquidity move and resulted in a win, while another trade taken with less analysis resulted in a loss. The week ends slightly positive, with a focus on improving execution and consistency.
Multi-Timeframe EURUSD Analysis
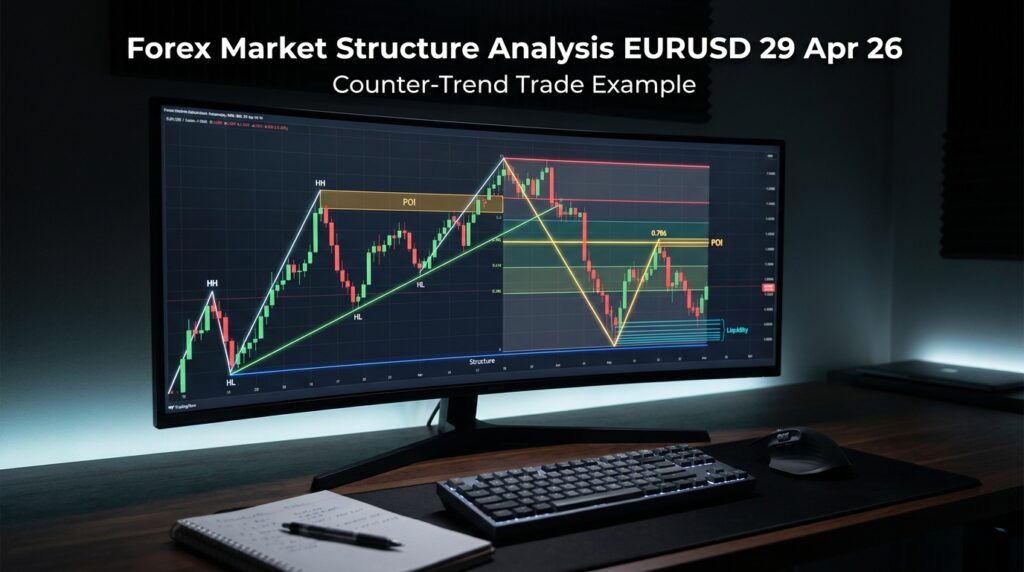
The analysis starts from the six-month timeframe, where the structure shows an upward movement. The range is clearly defined, with price reacting from an order block and taking inducement, supporting a bullish assumption. This forms the foundation of the EURUSD outlook, where the expectation is that price will continue moving upward based on probabilities.
Moving to the weekly timeframe, the structure continues to support the bullish direction. A break of structure confirms a new upward movement, with a clear low and high forming the current range. The reaction from the weekly order flow further supports the initial assumption made on the higher timeframe.
However, the shift becomes clear on the four-hour timeframe. While the higher timeframes suggest upward movement, price begins to move downward to target liquidity. This creates a situation where the trader is operating against the higher timeframe structure, focusing instead on the immediate objective of liquidity collection.
Execution Model and Trade Approach
The execution is based on lower timeframes, primarily the 15-minute chart. The process involves identifying structure, defining the range, and marking inducement levels. Once inducement is taken, a pending order is placed using the Fibonacci retracement tool, specifically at the 0.786 level.
Risk management remains consistent regardless of timeframe. Each trade risks 1 percent, with a target based on a fixed 1:3 risk-to-reward ratio. The stop loss is placed at the edge of the range, targeting external liquidity.
Trade management includes partial exits, where portions of the position are closed at different levels. However, this approach is under review, as it has reduced overall returns in winning trades. The actual outcome tends to reflect a 1:2 result due to this management style.
Trade Outcomes and Weekly Performance
The first trade of the week followed the four-hour assumption that price would move downward to capture liquidity. The setup aligned with the structure and execution model, resulting in a successful trade.
The second trade, taken later in the week, was based on a similar visual setup but lacked full analysis. The decision to move quickly to a lower timeframe without confirming structure led to a loss. Even when reviewing the setup on a slightly higher timeframe, the outcome would have remained the same, as structure was broken.
Overall, the week ends with one win and one loss. The current win-to-loss ratio stands at 1:1, with total performance slightly positive. While the numbers are modest, the focus is on improving trade selection and reducing unnecessary entries.
Reflections on Strategy and Execution
This week marks a shift toward a more structured and consistent approach. The use of market structure and SMC elements is now the primary method for analysis and execution. The process of asking whether price is moving toward or reacting from a point of interest helps streamline decision-making.
There is also a growing awareness of the need to avoid forcing trades when conditions are unclear. If price is not interacting with a clear point of interest, the correct action is to step away rather than continue searching for setups.
The reliance on counter-trend trades based on the four-hour timeframe is also being reconsidered. Adjustments may be needed to align trades more closely with higher timeframe structure.
FAQ
What is the main focus of this EURUSD analysis?
The focus is on applying Forex market structure analysis using multiple timeframes, with an emphasis on liquidity, inducement, and structured execution.
Why did price move down despite a bullish higher timeframe?
Price moved lower on the four-hour timeframe to capture liquidity, even though the overall higher timeframe structure remains bullish.
How are trades executed in this approach?
Trades are based on Fibonacci retracement at the 0.786 level, with defined stop loss and a fixed risk-to-reward ratio of 1:3.
What caused the losing trade this week?
The losing trade was taken without full analysis, as the decision was made quickly on a lower timeframe without confirming structure.
Is the current EURUSD outlook bullish or bearish?
The higher timeframe EURUSD outlook remains bullish, but short-term movements may still go downward to capture liquidity.
Conclusion
This Forex market structure analysis of EUR/USD reflects a practical and evolving approach to trading. The combination of higher timeframe bias and lower timeframe execution provides a structured framework, but results depend heavily on discipline and consistency. With one win and one loss, the week highlights both progress and areas for improvement. The focus moving forward remains on refining execution, improving trade selection, and maintaining a consistent process through each EURUSD analysis.

The Investor
Wednesday 29 April 2026
About The Author
I started to look into individual stocks in January 2022. I created this diary initially for myself to track my investing progress, and second, as a place where I can share my ideas publicly, not only on stock investment, but on any venture that I start learning, such as Forex Trading, Blogging, or any other future venture that I might think of trying out.
By repeating things to myself, I learn by trying to explain them to others; therefore, I help myself better understand what I am learning. Additionally, hoping that others will share their ideas and learn from each other, and lastly as an online business where some links that I share are affiliate links, and if anybody bought anything by clicking those links, I will get a commission based on that successful sale, which of course will not affect the price at which you are buying the product or service.
For more detailed information on my affiliate disclosure, please refer to the Full Affiliate Disclosure page.
This blog is also part of my blogging learning project. I’m using a platform to learn this part. If you are interested in it, it is called Wealthy Affiliate.
Furthermore, this site is in no way or form giving any financial or investing advice, nor is it encouraging or discouraging people to buy or sell any financial instrument. This is a personal diary in which I track my own progress and share it for informational, educational, and entertainment purposes.