The Investor Diary Entry #136: May 7, 2026
In this post, I am sharing what I have been learning about the GBPUSD pair. I have two main objectives to talk about. One is mapping or looking at the market structure mapping of the GBPUSD. The other one is the difference in broker prices versus TradingView prices, especially for new traders or beginners. I found that this difference means I need to adjust my prices. Experienced traders already know this and make such adjustments. I just realized this myself.
TL;DR
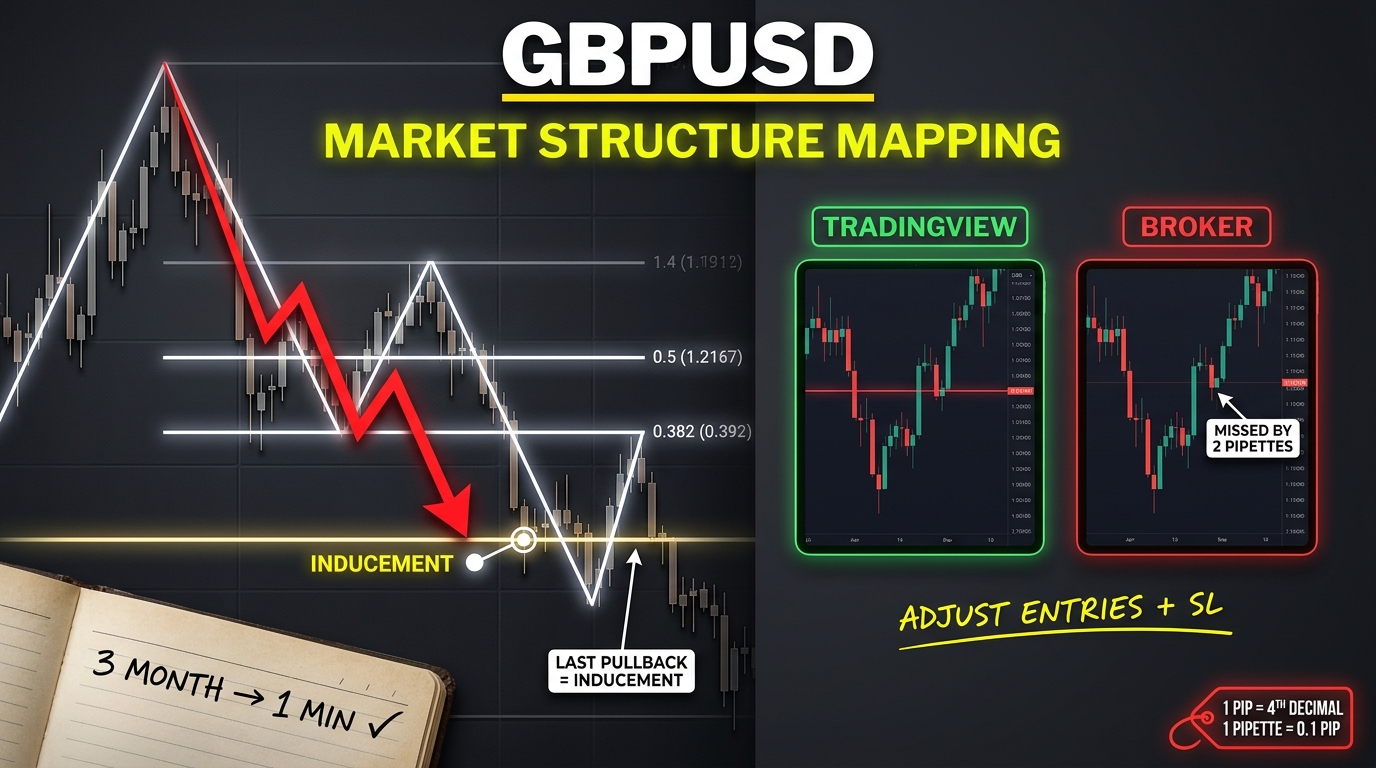
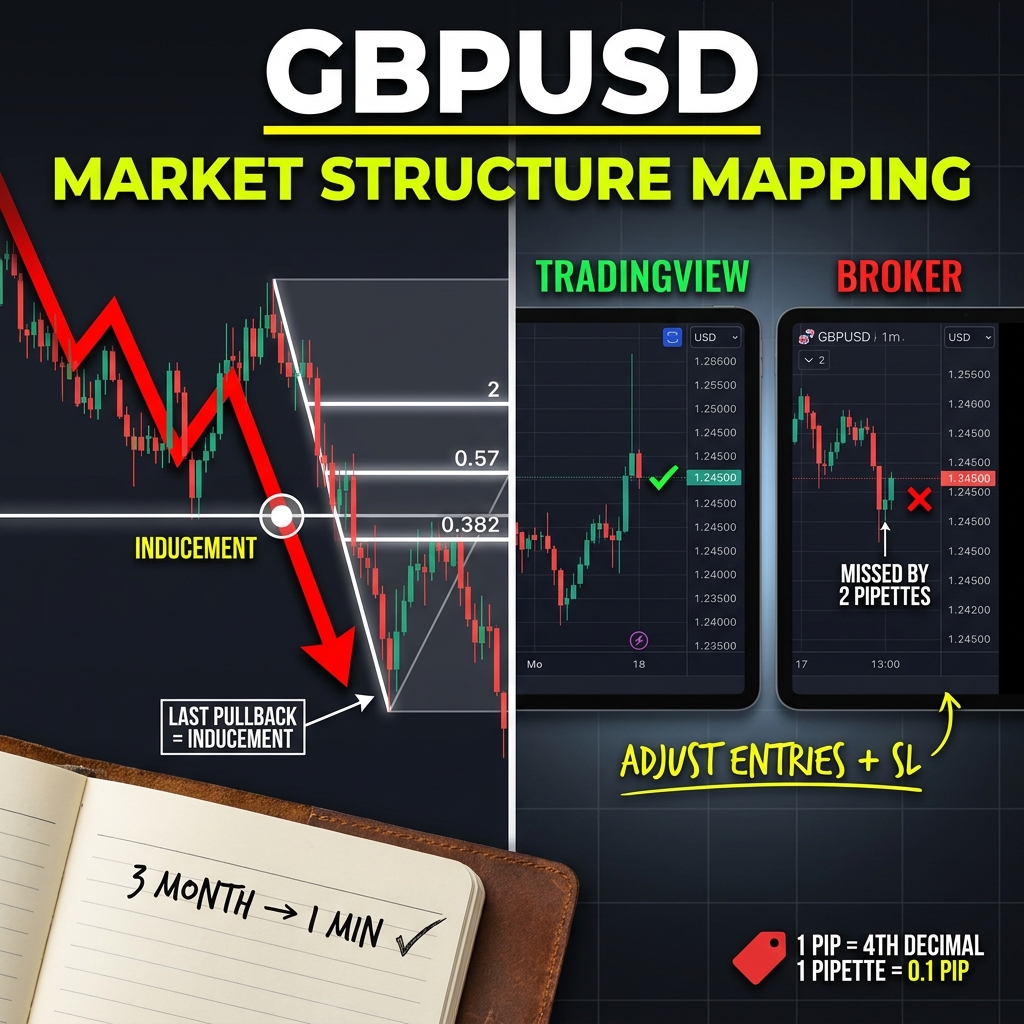
I map GBPUSD market structure from the three month down to the one minute timeframe. The pair shows two structures happening at the same time across timeframes. I identify inducement levels, break of structure, order flow, and change of character. I also discovered that broker prices differ from TradingView prices by one to three pipettes. This caused my entry to be hit on TradingView but not on my broker demo account. I am now studying how to adjust my entries and stops accordingly.
Three Month Structure and Inducement
I start my forex market structure analysis from the three month chart. I look for a break of structure. The highest point of that break or of that retracement becomes the high point of the range. The last pullback before the lowest low is the inducement level. I need that inducement level to be hit to identify this as an official swing low. If this inducement is not hit, and the price goes and breaks it, I do not call it a break of structure according to what I have been taught.
I repeat this in many videos. I explain everything in this diary for two objectives. One is for me to understand that I understand and to instill the information better in my head. The other is if anybody is in the same phase as I am, maybe the information might be useful.
Order Flow and Engulfing
In my forex market structure mapping, I also look at order flow. Order flow is one of the points of interest. It is the opposing move before continuing in the main move. If the main move is going down, the opposing move is the order flow. A smaller order flow can be engulfed in a larger order flow. If a pullback or an order flow happens in an area that is engulfed, I keep the inducement at the original level.
Weekly and Four Hour Interaction
The area of my interest on the three month means on the weekly, this is where I am interested in. On the weekly, I have a break of structure again. The inducement of the three month is the high of the week, the high of the range of the week. The structure is bearish, but the internal structure on the weekly is going upward. It is either going to one of the points of interest of the weekly, or to go with the three month and take the inducement, or even move higher to take other points of interest above the inducement, and then move down.
If the weekly levels are not respected and the three month inducement is hit, the structure on the weekly changes character to become bullish on a three month structure that is bearish. Internally, I deal with the weekly structure as a bullish structure until it reaches one of these points.
Moving lower to the four hour, I have a change of character. This becomes the high of the range shared with the daily high of the range. I have a bearish structure, but I also have a bullish structure reacting from a daily point of interest. The reaction did not come from order flow or from an order block. It came from sweeping the engineering liquidity of the daily.
Fibonacci Rule and Inducement Shifts
There is an important rule. When I use Fibonacci, if an inducement is hit but the retracement does not touch the 0.5, it is fine if it touches the 0.382 only on a condition that on a higher timeframe this would be a pullback. If these conditions are not met, the inducement moves to the higher point. I track where the high was broken. If it was broken without the retracement, I move the inducement. In repetition, beautiful things happen.
In my journal, I always start with the three month or the six month depending on the case of the pair. I start analyzing with that same timeframe every time. Every time there is something new.
Lower Timeframes and Weak Points of Interest
On the 15 minute, a point of interest can be weak. Weak means it happened before the change of character. After a change of character, I do not consider levels as valid points of interest. I consider the ones before the break of structure. I show an example of how I do the mapping. On a bearish change of character, I do nothing after it. I do it before.
Execution and Broker Price Difference
I take entries not based on when I make an execution. I do not take point of interest entries. I put the points of interest only until the 15 minute timeframe. On the one minute where it is execution, I deal with Fibonacci 0.786. On higher timeframes, I either use this Fibonacci 0.786 for execution or use the reaction of the points of interest on a lower timeframe.
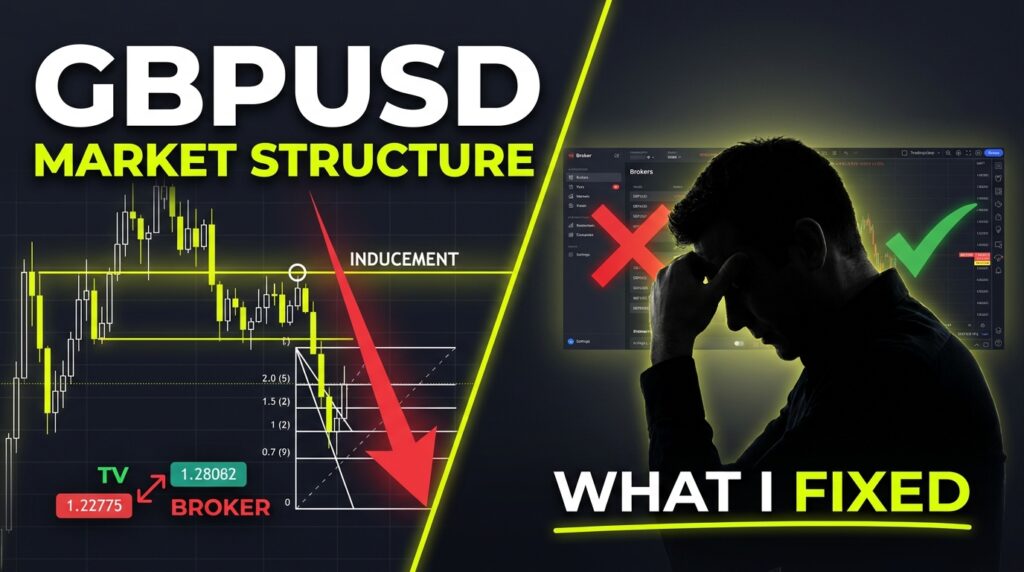
I had a retracement that hit the entry price on TradingView, but on my broker demo account, it did not. The difference is one to two pipettes. I saw a three pipette difference, but my broker has one pip. The pip is the fourth number on GBPUSD. The pipette is the small difference, one, two, three pipettes maximum. On my broker platform, the difference is one pip plus four pipettes or three pipettes. Because of this difference, it did not catch my trade and I lost a winning trade. The TradingView chart closed at one level, and my broker closed at another level.
Adjustments I Am Studying
There are a few adjustments I want to make on my trading. One is to connect the price reaction on the higher time frame and the execution on a lower time frame properly. The second is to make adjustment to the pips to avoid the differences between Tradingview prices and my Broker prices. I am studying how I will do this. If I am buying, I will put the price a little bit above and the stop loss a little bit below. The opposite when I am selling.
FAQ
What is forex market structure mapping?
Forex market structure mapping is the process I use to identify swing highs, swing lows, break of structure levels, inducement levels, and order flows/order blocks across multiple timeframes. I start from the three month chart and move down to the one minute for execution.
Why does GBPUSD have an interesting structure?
GBPUSD has two structures happening at the same time on many timeframes. The main structure might be bearish while the internal structure is bullish. This interaction between the main structure and the reaction structure is what makes the pair interesting to analyze.
What is an inducement level?
The inducement level is the last pullback before the lowest low in a bearish structure. I need that inducement to be hit to officially call a break of structure. Without the inducement being hit, a move lower is not a valid break of structure according to what I have learned.
What is the difference between a pip and a pipette?
On GBPUSD, the pip is the fourth number after the decimal. The pipette is the small difference beyond that. Broker prices and TradingView prices can differ by one pip, which affects whether my entry gets hit.
How do I adjust for broker and TradingView price differences?
I am studying this adjustment. If I am buying, I plan to put my entry price a little bit above the level and my stop loss a little bit below. I do the opposite when I am selling. This accounts for the spread difference between TradingView charts and my broker platform.
Conclusion
This is what I am doing and learning. I get 90% of what I am saying from learning online or in books. Most of what I talk about in terms of market structure, I learned from someone on YouTube. I post this video on different platforms, and many of these platforms do not allow such reference. I hope this post was as useful to me as it was to you. I changed a few things in my own approach, and I am looking forward to continuing this journey.
The Investor
Thursday 7 May 2026
About The Author
I started to look into individual stocks in January 2022. I created this diary initially for myself to track my investing progress, and second, as a place where I can share my ideas publicly, not only on stock investment, but on any venture that I start learning, such as Forex Trading, Blogging, or any other future venture that I might think of trying out.
By repeating things to myself, I learn by trying to explain them to others; therefore, I help myself better understand what I am learning. Additionally, hoping that others will share their ideas and learn from each other, and lastly as an online business where some links that I share are affiliate links, and if anybody bought anything by clicking those links, I will get a commission based on that successful sale, which of course will not affect the price at which you are buying the product or service.
For more detailed information on my affiliate disclosure, please refer to the Full Affiliate Disclosure page.
This blog is also part of my blogging learning project. I’m using a platform to learn this part. If you are interested in it, it is called Wealthy Affiliate.
Furthermore, this site is in no way or form giving any financial or investing advice, nor is it encouraging or discouraging people to buy or sell any financial instrument. This is a personal diary in which I track my own progress and share it for informational, educational, and entertainment purposes.