The Investor Diary Entry #133: May 4, 2026
After understanding Forex trading terminology and currency pairs, the next natural step is to learn how to read Forex charts. Chart reading might seem complicated at first, but once you know what to look for, things start to make a lot more sense. These charts are the tools that Forex traders rely on to make decisions about when to buy or sell currency pairs, so they’re pretty important if you want to get into the Forex market. I’m here to break down the basics of Forex charts, show you how to understand what you’re looking at, and hopefully help you feel much more confident as a beginner.
TL;DR: How to Read Forex Charts as a Beginner
Learning how to read Forex charts is really important for anyone starting out in Forex trading. Start with understanding the different types of Forex charts, like line, bar, and candlestick. Get familiar with what currency pairs are, learn how to spot trends, and use timeframes that fit your trading style. Pay attention to price patterns, support and resistance, and use basic technical indicators to help you make smarter trading choices. With steady practice, reading Forex charts will become much more natural and can help you make informed trading decisions.
What Are Forex Charts and Why Do They Matter?
Forex charts are graphical pictures of how a currency pair’s price moves over time. These charts help traders see patterns, spot trends, and make decisions about when to buy or sell. Every chart tells a story about how traders feel about a particular currency pair at any given moment. If you’re planning to follow the Forex market steps, understanding these charts gives you a solid foundation before you put your money on the line.
There are different timeframes for charts; some people like looking at five-minute charts for quick moves, while others zoom out and look at daily or even weekly charts for longer-term views. No matter your style, charts give you the core information you need to find your way in the Forex market. For beginners, spending time with a demo account and flipping between these timeframes can help you figure out what feels comfortable and effective for your goals.
Main Types of Forex Charts Every Beginner Should Know
There’s not just one way to display price movement in Forex. Here are the three most common chart types you’ll see as you learn how to read Forex charts:
- Line Charts: The simplest type, connecting closing prices with a line. Great for getting a sense of the overall direction but doesn’t show much detail.
- Bar Charts: Show open, high, low, and close prices for each time period. They give a bit more information than line charts and can help with spotting reversals or volatility.
- Candlestick Charts: The most popular type. They show the same info as bar charts, but in a much easier to read format. Candlesticks are super helpful for spotting patterns and trends and are widely used among traders at every level.
Almost every Forex trading platform lets you switch between these chart types, so you can experiment and see which one feels easiest for you to read. Try spending a few days with each style just to get used to the way information is shown.
Getting to Know Currency Pairs and the Quotes
If you’re new to Forex, you’ll hear the term currency pairs a lot. In Forex, every trade involves two currencies, one you’re buying and one you’re selling. The first is called the base currency, and the second is the quote currency. For example, in the EUR/USD pair, the euro is the base currency and the U.S. dollar is the quote currency.
On charts, you’ll see the exchange rate for each currency pair plotted over time. This number tells you how much of the quote currency you need to buy one unit of the base currency. Understanding currency pairs makes reading any Forex chart a whole lot easier. Different pairs also behave in their own ways, with majors like EUR/USD or GBP/USD often showing higher liquidity and lower spreads compared to exotic pairs. Knowing which pair you’re looking at is as important as knowing how the chart works.
Additionally, each currency pair is affected by different regional economic reports and events. Keeping track of economic calendars for the currencies you trade can help you make sense of big price moves. Over time, this context will let you spot potential opportunities and assess risks more accurately.
Key Elements of a Forex Chart: What to Look For
- Price Axis (Y-Axis): Runs vertically and shows the price of the currency pair.
- Time Axis (X-Axis): Runs horizontally and marks the time period being viewed (minutes, hours, days, etc.).
- Chart Type: Line, bar, or candlestick, explaining how price is displayed.
- Volume (Optional): Sometimes shown below the main chart, shows how many trades happened during each period. Not every Forex chart includes this, as Forex is decentralized and true volume is harder to measure compared to stocks.
Once you’re comfortable with these pieces, you can focus on what really matters: price action and identifying trends. Many platforms also let you overlay other features, like indicators or drawing tools, to help you map out your ideas and keep your analysis organized.
How to Read Forex Charts Like a Pro: Step-by-Step
- Choose Your Chart Type: Most beginners find candlestick charts the easiest to interpret, so start there.
- Select Your Timeframe: Decide if you want to look at price changes over minutes, hours, days, or weeks. Shorter timeframes are for quick trades, while longer frames are better for big-picture trends.
- Understand the Candlestick (or Bar): On each candlestick, the body shows the opening and closing price, while wicks show highs and lows. A green or white candle means the price went up; red or black means it went down.
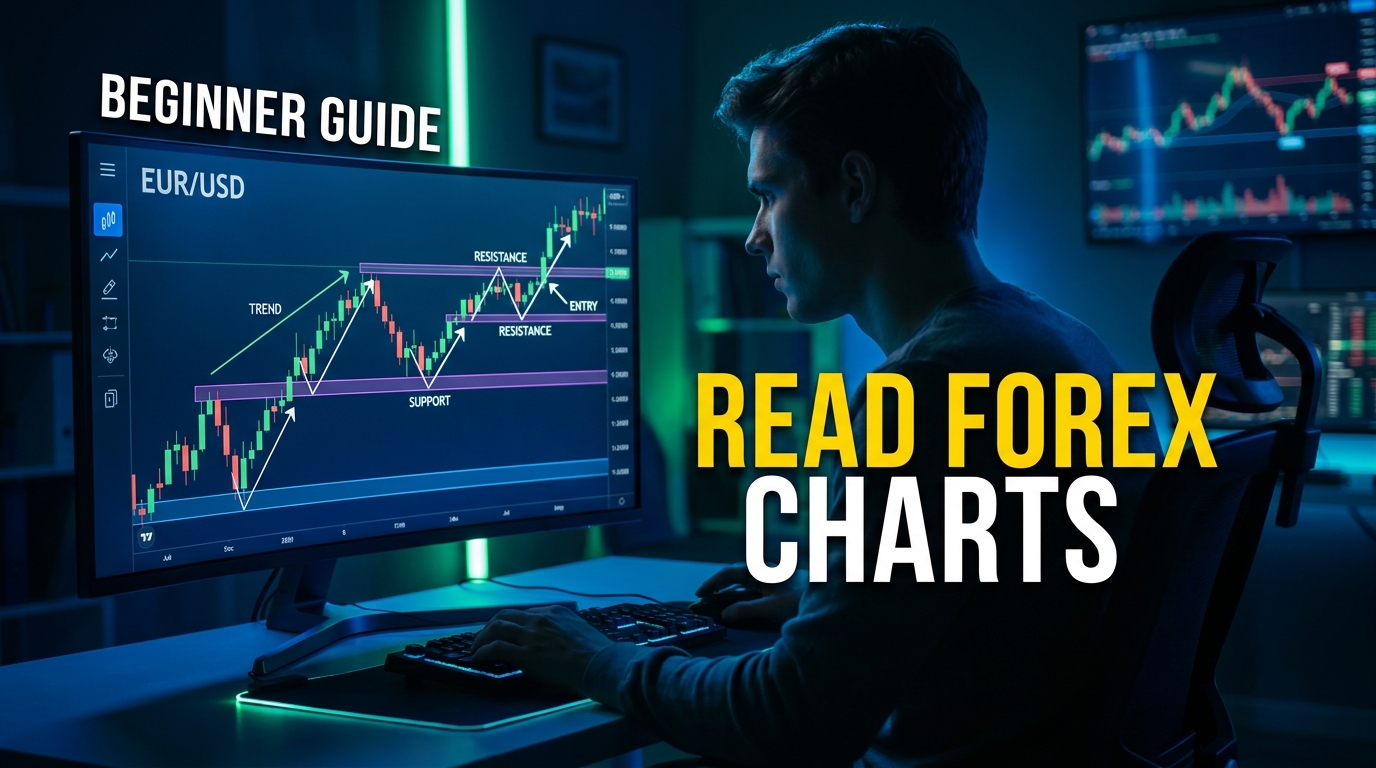
- Spot the Trend: Look at the overall direction of the chart. Are prices generally moving up (bullish), down (bearish), or sideways (consolidating)? Marking trends can help you decide when and what to trade.
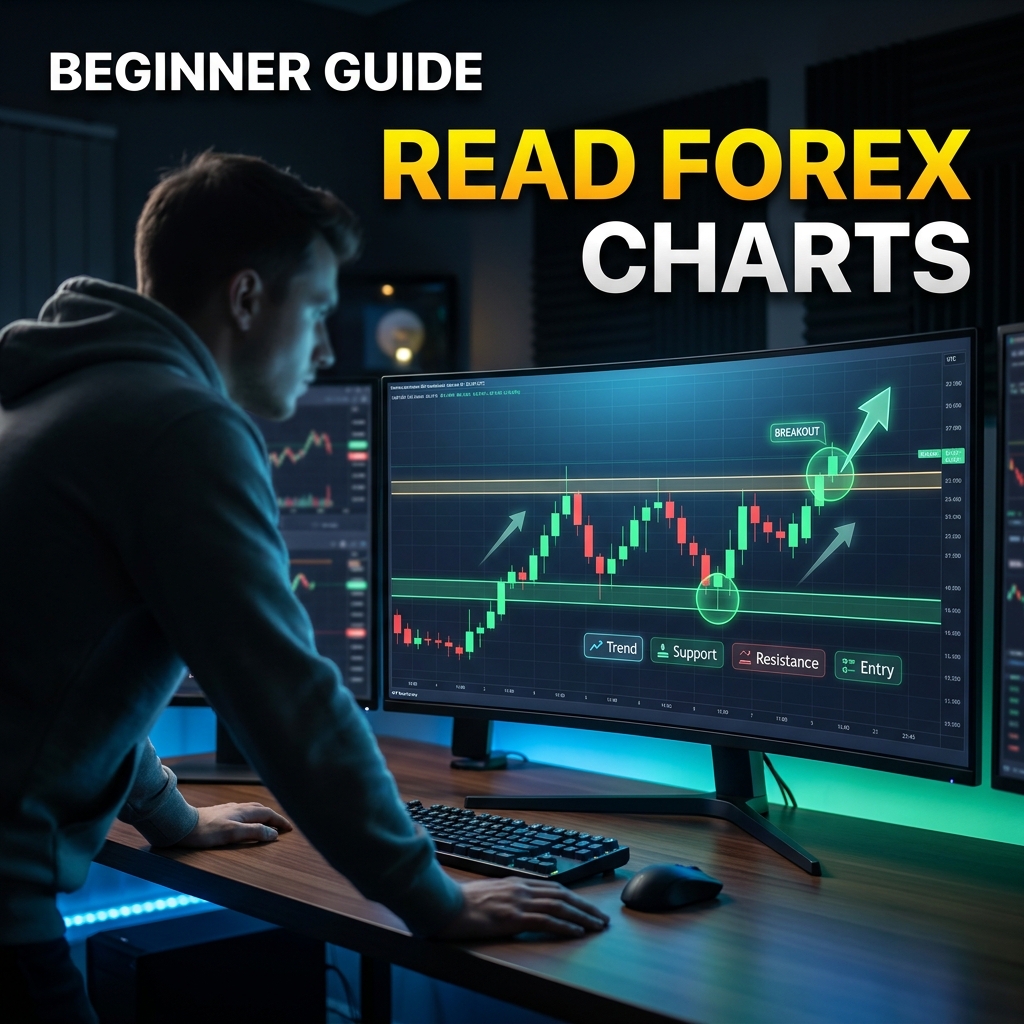
- Find Key Levels: Support is where price bounces up; resistance is where price hits a ceiling and drops back down. Drawing horizontal lines at these points can help you map out your trades.
- Look for Patterns: Patterns like “double top,” “head and shoulders,” or “flags” can point to possible trend changes or continuation. These classic setups appear often in Forex and are worth learning.
- Use Basic Indicators: Tools like Moving Averages or the Relative Strength Index (RSI) can add extra info for your decisions. Start simple and add more only if they help you understand the chart better.
As you get more comfortable, you’ll start to see how these steps come together to help you make smarter trading decisions. Try applying these steps to some demo charts until it starts to feel natural.
Common Pitfalls for Beginners (And How to Avoid Them)
- Overcomplicating Things: It’s easy to get lost in too many indicators and fancy tools. Stick with the basics first and add complexity slowly.
- Ignoring the Big Picture: Zoom out regularly to check the overall trend. Don’t get stuck on tiny moves, always keep the wider context in mind.
- Trading on Emotion: Letting fear or greed make your decisions instead of what the chart shows usually ends badly. Practice using a plan and sticking to it.
- Skipping Practice: Use a demo account to practice reading and trading before risking real money. This lets you build skills without pressure.
Staying focused and practicing how to read Forex charts will help you avoid the most common mistakes that trip up beginners. Mistakes are normal, but with practice you’ll gain more confidence and make better choices.
Advanced Tips: Moving Beyond the Basics
Once you’re comfortable finding trends and spotting basic patterns, check out these more advanced ideas:
- Zoom In and Out: Check multiple timeframes to spot both short-term and long-term trends. This will help you see if what’s happening on a quick time scale matches the bigger trend.
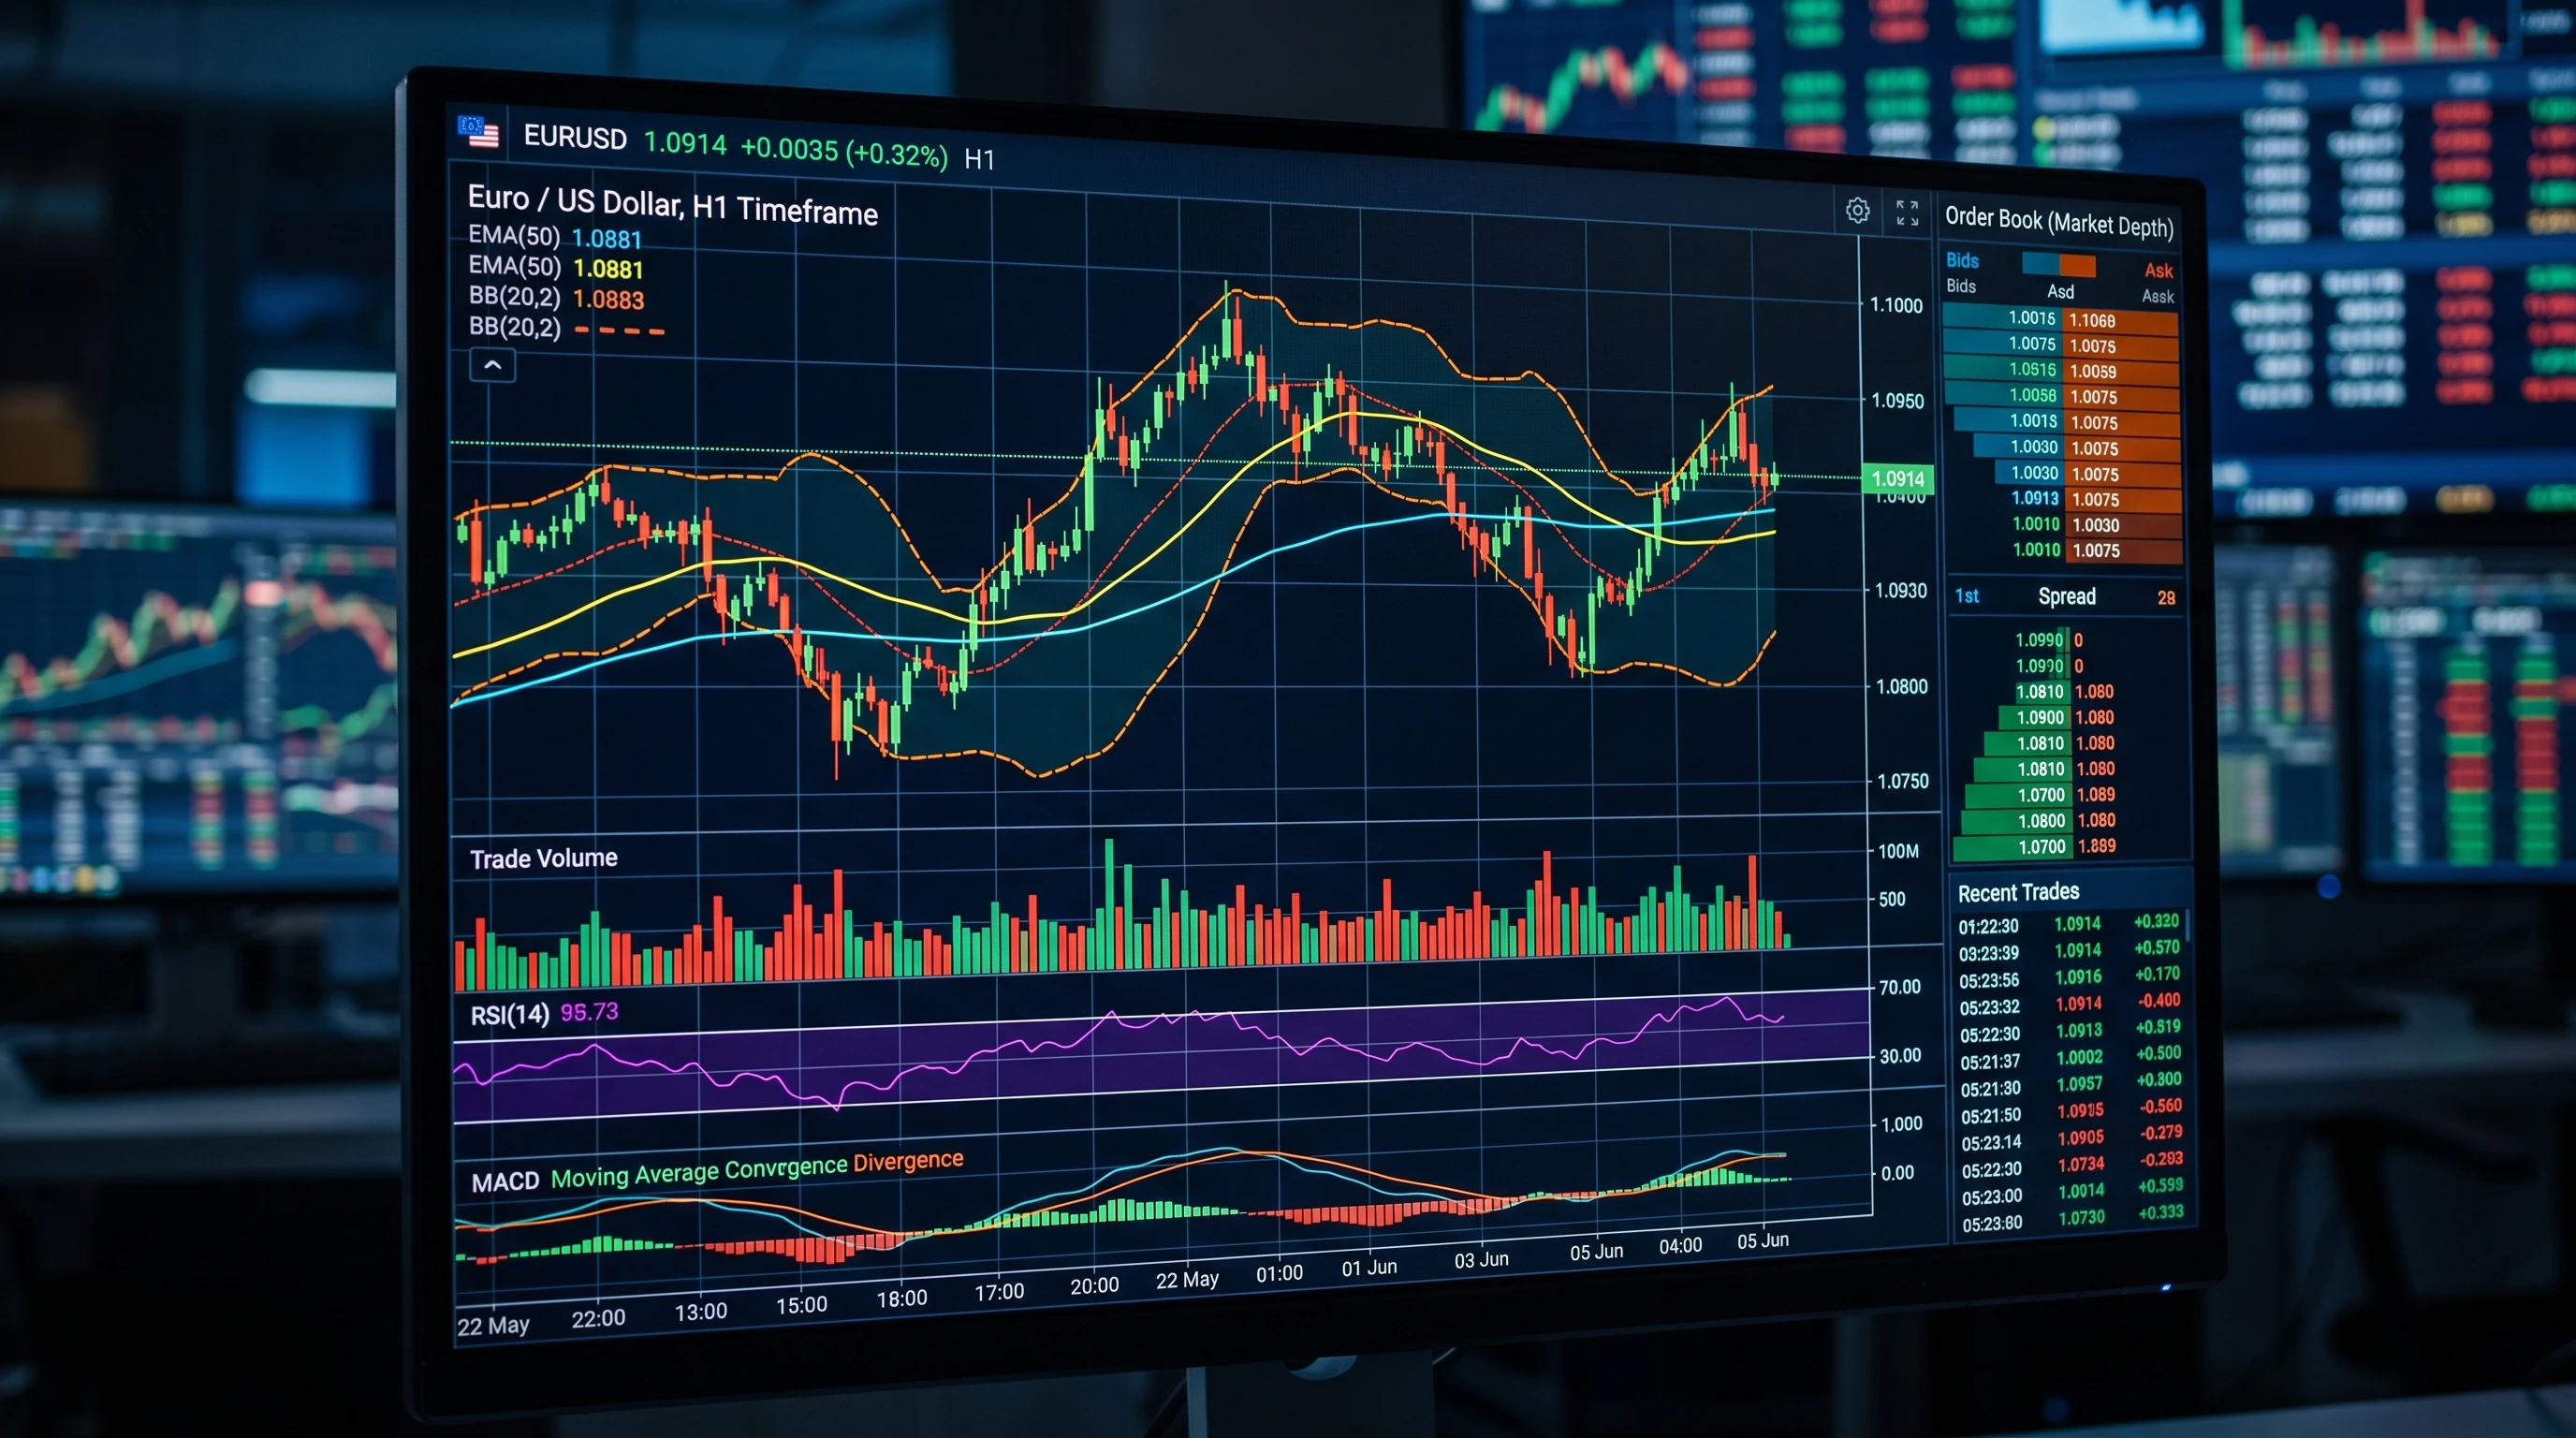
- Try Advanced Indicators: Tools like Fibonacci retracement, MACD, or Bollinger Bands can help you pick more precise entries and exits, but always use them with your core analysis for the best results.
- Keep a Trading Journal: Write down why you made each trade. Over time, you’ll spot patterns in your decision-making, which is really useful for improvement. Revisiting old trades can help you learn from both wins and losses.
Building your skills step by step is the way to go. No one masters trading overnight, but a little patience and committed practice go a long way.
Real-World Example: Analyzing a EUR/USD Chart
I remember the first time I tried reading a EUR/USD candlestick chart. At first, it looked like a mess of green and red blobs, but then I noticed a series of higher highs and higher lows over several days, an uptrend. By marking support and resistance and watching for a bullish candlestick pattern near support, I ended up making a small, but successful, trade. Focusing on these basics can give you a big boost of confidence as you try your first live trades. There’s nothing quite like seeing your analysis pay off, even on a small scale.
Frequently Asked Questions
How do I know which chart type to use?
Most traders, even professionals, rely on candlestick charts because they show so much info at a glance. You can switch back and forth until you find the one you like best, but candlestick charts are usually the most beginnerfriendly.
What’s the best timeframe for a beginner?
If you’re just starting out, daily or fourhour charts make it easier to spot real trends and aren’t as noisy as short timeframes. Once you have more experience, you can try shorter timeframes for quicker trades.
Do I need to use indicators?
You don’t need them, but a couple of simple indicators like Moving Averages or RSI can give you extra clues. Don’t overload your chart with too many at once, though.
How important is it to learn about currency pairs?
Understanding currency pairs is super important for anyone wanting to trade Forex. Since every trade involves two currencies, knowing what they represent helps you interpret charts more accurately.
What are the basic steps to get started in Forex trading?
Following the basic Forex market steps, like picking a broker, opening a demo account, and practicing chart reading, lays a solid foundation for safer and smarter trading.
Final Thoughts
Learning how to read Forex charts might look intimidating, but it’s really about building your chart-reading skills one step at a time. Start with understanding the types of charts, get a feel for currency pairs, and practice spotting basic patterns and trends. Keep things simple at first and use practice accounts to test your new knowledge. With a little patience, reading Forex charts gets much easier and can start to feel like second nature. Good luck with your trading adventure!
Today, I don’t use any indicators, I only use market structure mapping.
The Investor
Monday 4 May 2026
About The Author
I started to look into individual stocks in January 2022. I created this diary initially for myself to track my investing progress, and second, as a place where I can share my ideas publicly, not only on stock investment, but on any venture that I start learning, such as Forex Trading, Blogging, or any other future venture that I might think of trying out.
By repeating things to myself, I learn by trying to explain them to others; therefore, I help myself better understand what I am learning. Additionally, hoping that others will share their ideas and learn from each other, and lastly as an online business where some links that I share are affiliate links, and if anybody bought anything by clicking those links, I will get a commission based on that successful sale, which of course will not affect the price at which you are buying the product or service.
For more detailed information on my affiliate disclosure, please refer to the Full Affiliate Disclosure page.
This blog is also part of my blogging learning project. I’m using a platform to learn this part. If you are interested in it, it is called Wealthy Affiliate.
Furthermore, this site is in no way or form giving any financial or investing advice, nor is it encouraging or discouraging people to buy or sell any financial instrument. This is a personal diary in which I track my own progress and share it for informational, educational, and entertainment purposes.