The Investor Diary Entry #137: May 25, 2026

Trading is built on observation, adjustment, and the willingness to revisit your approach when things are not working. Trading is not a straight line, where one sets a bunch of rules and then expect things to run as per the process drawn.
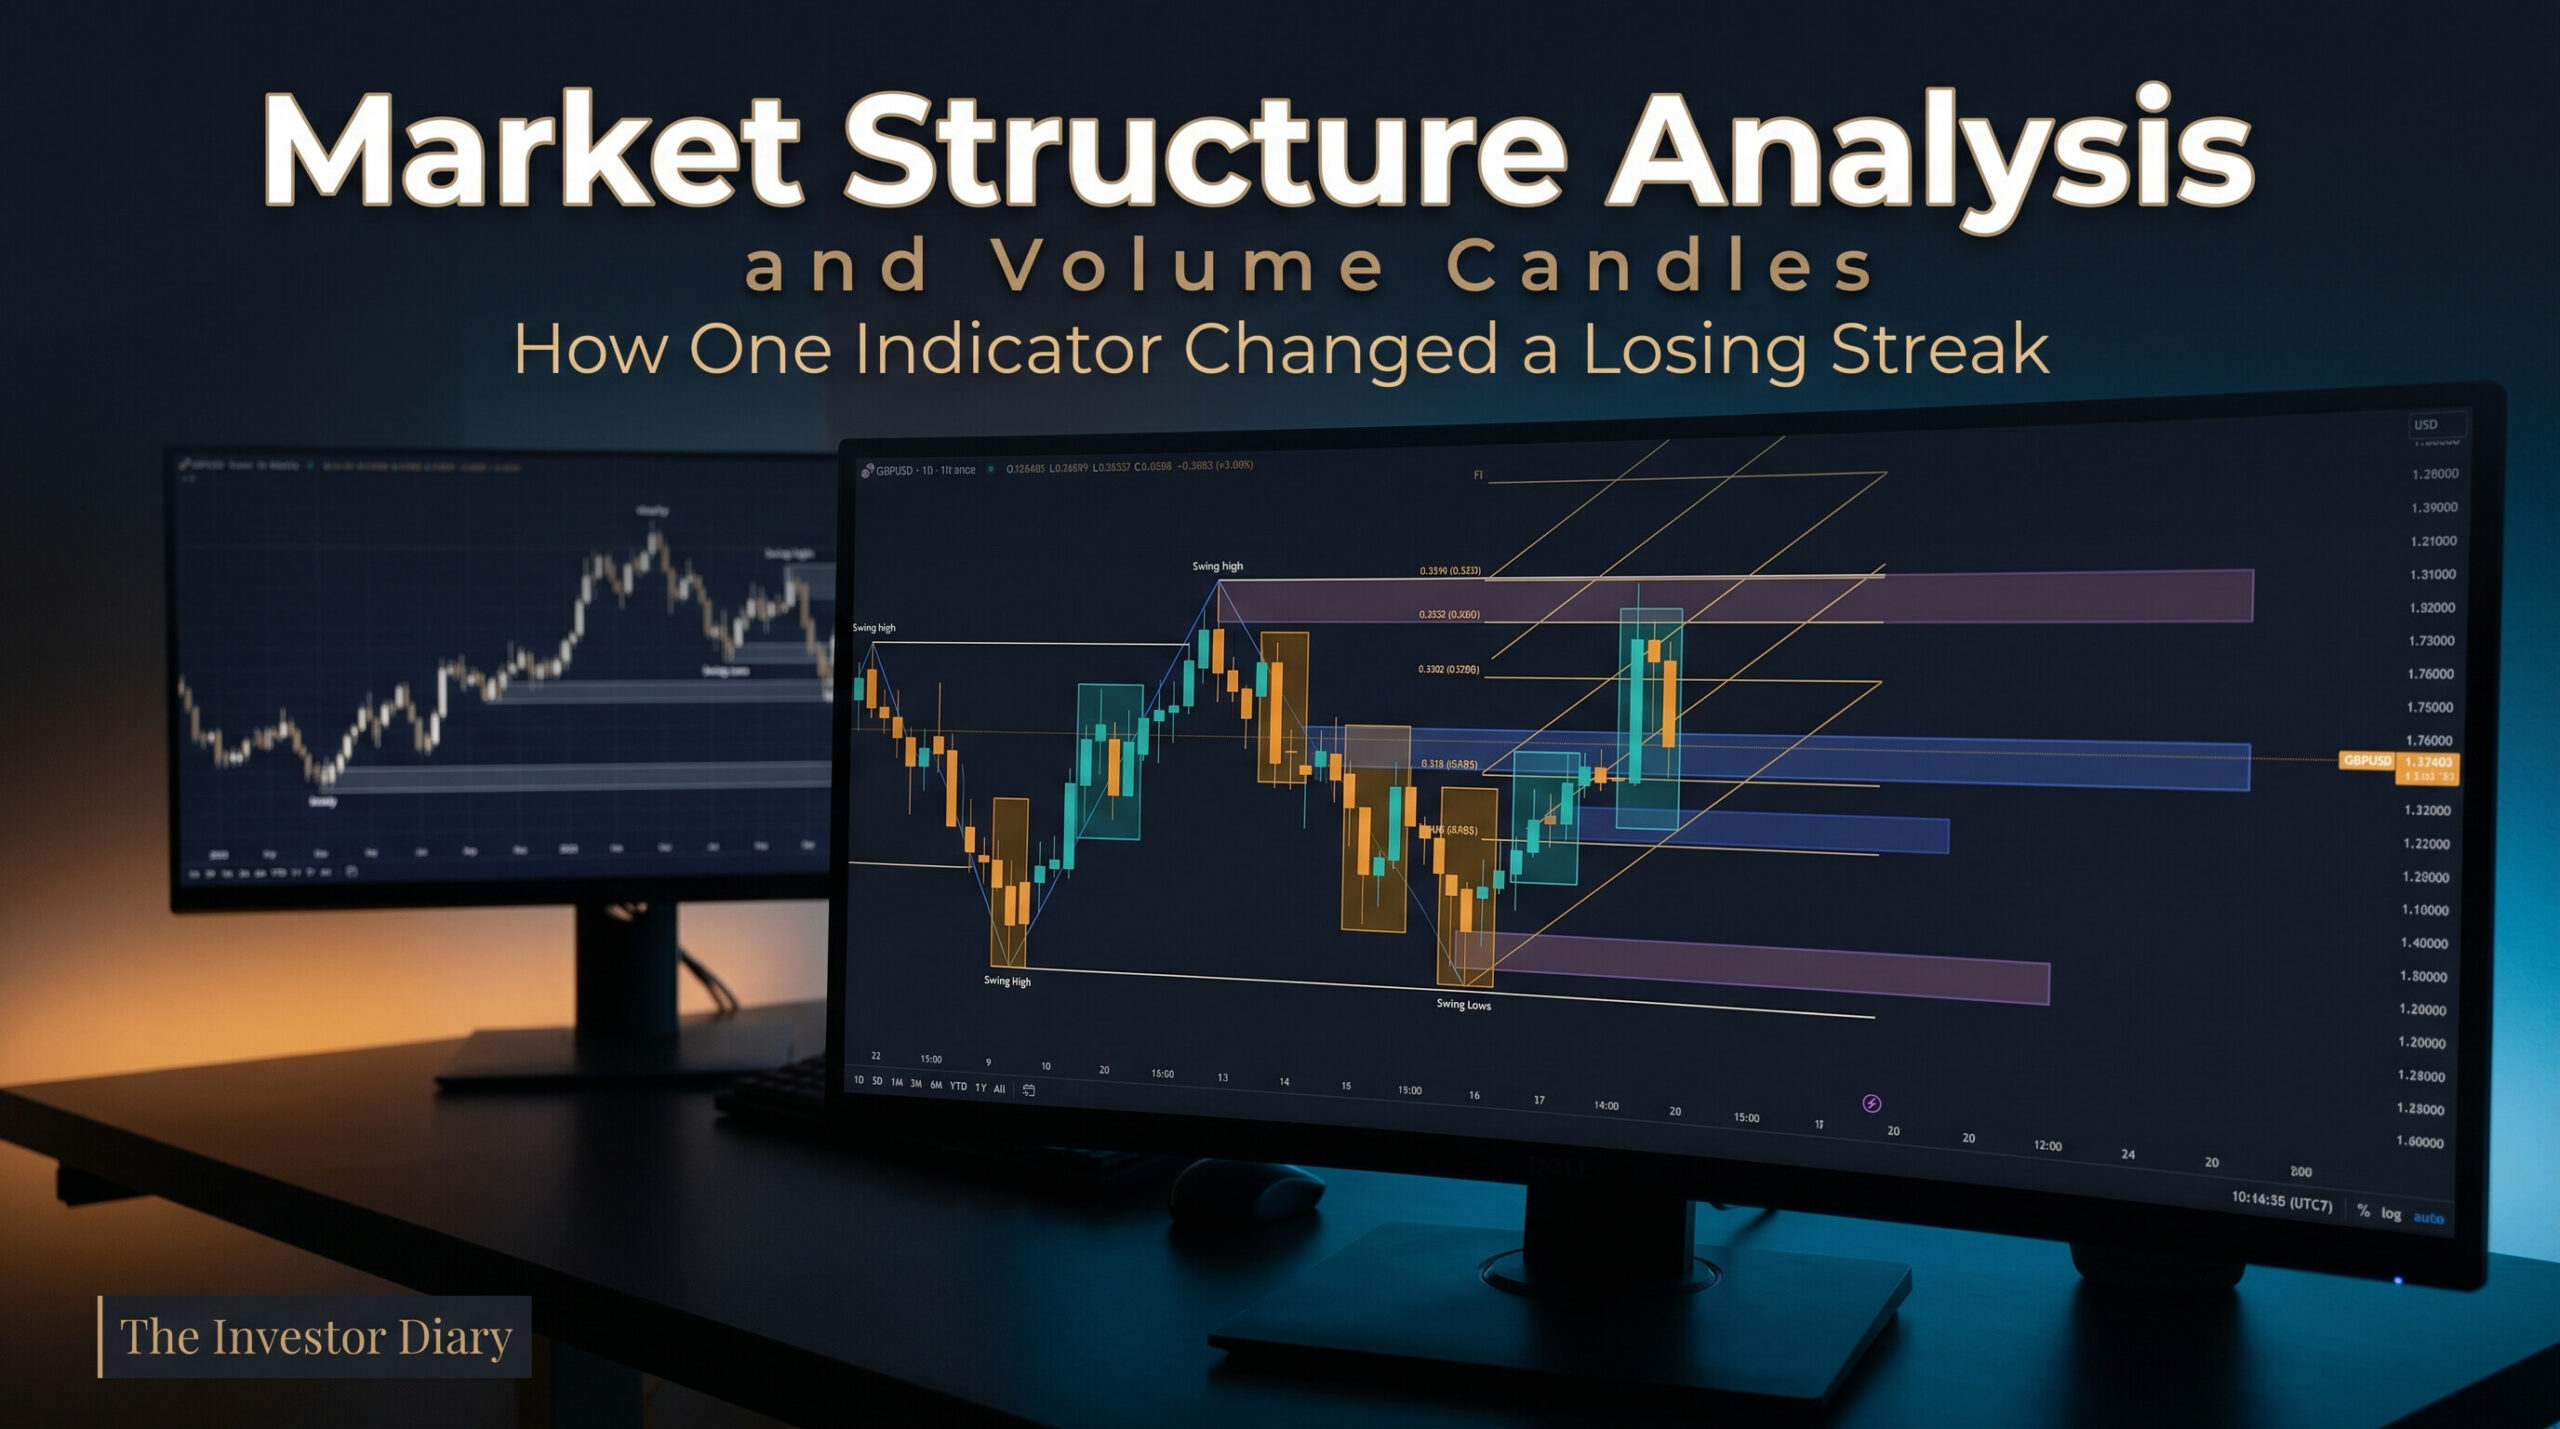
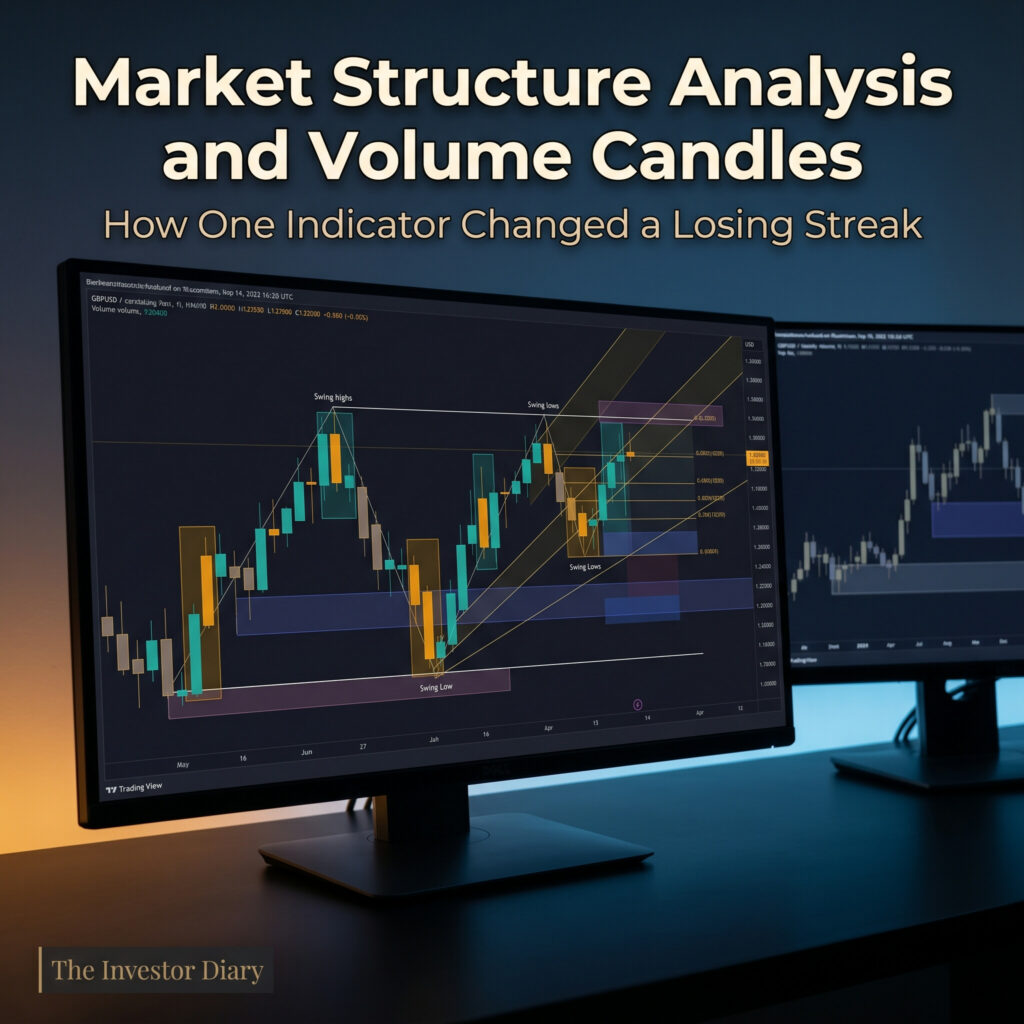
This post walks through a real session on the GBPUSD, where a period of losses led to a methodology update, specifically the introduction of the JS Climatic Volume candles alongside an existing market structure framework.
TL;DR
After a streak of losses at the end of April, the author revisited his trading approach and introduced the JS Climatic Volume indicator to complement his existing market structure mapping and analysis. The update helped filter entries that the Fibonacci tool alone was missing, resulting in a profitable session. Two structure-based trades on the GBPUSD closed at a loss, but a volume candle entry on the EURUSD closed in profit.
The GBPUSD Story: Starting From the Top
Understanding any trade begins with the higher timeframes. On the three-month chart, the GBPUSD showed a bearish break of structure with an inducement sitting above price. The expectation at that level was for price to push up and reach that inducement before any serious downward continuation.
The weekly chart confirmed the same bias. A bearish structure was in place, with the high and low of the weekly range identified. Inside that range, the internal structure showed a reaction from an order block, though price did not quite reach the weekly high. This left the assumption intact: price was still expected to push upward to collect liquidity before any strong move lower. This kind of market structure analysis work across multiple timeframes is what frames the entire trading decision before any entry is considered.
Drilling Down to the Four Hour and 15 Minute
On the four-hour chart, the broader structure was bearish with a change of character to the downside, but the internal structure was pointing up. That conflict is normal. The expectation was for price to gather liquidity for an upward push before eventually continuing lower. A weak order flow area was identified but not used as an entry because it had been mitigated too many times to be considered reliable.
The 15-minute chart added more context to the session. A bullish structure was identified based on the reaction seen on the four-hour, with an inducement sitting below price. The internal structure on the 15-minute was going through a cycle of collecting liquidity in a ranging environment. There was no high-impact economic event to explain the specific behavior at the time, but the structural read was clear: price was expected to continue upward.
This process of working through the timeframes is essentially what market structure mapping looks like in practice. Each layer adds a piece of the picture, and entries only make sense when the layers agree.
Where the Volume Candle Indicator Comes In
The JS Climatic Volume is a volume candlestick indicator that highlights specific candles where volume reaches a climactic level. When a colored volume candle appears, it is treated as a support or resistance zone. The method is to draw a rectangle from wick to wick across the full range of that candle. Price interacting with that rectangle from above is a sell signal; from below, it is a buy signal. Some traders use it to trade within the rectangle, but that is a different approach.
The reason this tool was introduced is practical. The existing methodology relies heavily on the 0.786 Fibonacci retracement to time entries. The problem is that price does not always retrace to the 0.786 before moving. Watching price run in the expected direction without triggering an entry is frustrating and costly in terms of missed opportunity. The volume candlestick indicator offers an alternative entry trigger when price is already moving and the 0.786 has not been reached.
What Happened on the Day
Two entries were taken on the GBPUSD using the structural methodology. Both closed at a loss. One was a counter-trend sell targeting the 15-minute inducement, using a volume candle as the trigger. Price hit the target briefly before reversing and closing the trade in a loss. A second attempt using a rejection block and the 0.786 Fibonacci was stopped out before price moved in the anticipated direction.
A third entry was taken on the EURUSD using only the volume candle logic, and that one closed in profit. The overall session ended positive, which pointed to the volume candlestick indicator adding real value to the approach.
FAQ
What is the JS Climatic Volume indicator?
It is a volume-based indicator that identifies candles where volume reaches an extreme level. Those candles are then treated as support or resistance zones, with the full range of the candle marked as a rectangle on the chart.
How is the volume candle rectangle used for entries?
If price approaches the rectangle from below, it is considered a buy signal. If price approaches from above, it is a sell signal. The entry is taken when price reacts to the boundary of that rectangle.
Why was the volume candle tool added to the methodology?
The existing approach depended on the 0.786 Fibonacci retracement for entries. Price often moved without retracing that far, causing missed trades. The volume candle tool provides an alternative entry point when price is already in motion.
Were all the trades on this day winners?
No. Two structure-based trades on the GBPUSD resulted in losses. One volume candle trade on the EURUSD was profitable. The session ended in an overall gain.
Is the author trading a live account?
No. The session described was conducted on a demo account. The author has stated clearly in multiple videos that live trading has not begun.
Conclusion
The core lesson from this session is that a methodology is not a fixed system. It is something that gets tested against live market conditions, evaluated honestly, and adjusted. After a difficult stretch at the end of April, stepping back and adding the volume candlestick indicator gave the approach a new entry mechanism that does not depend entirely on waiting for a specific Fibonacci level. That change made a difference on this particular day. Whether it holds up over more sessions is something that only time and continued observation will answer.
The Investor
Monday 25 May 2026
About The Author
I started to look into individual stocks in January 2022. I created this diary initially for myself to track my investing progress, and second, as a place where I can share my ideas publicly, not only on stock investment, but on any venture that I start learning, such as Forex Trading, Blogging, or any other future venture that I might think of trying out.
By repeating things to myself, I learn by trying to explain them to others; therefore, I help myself better understand what I am learning. Additionally, hoping that others will share their ideas and learn from each other, and lastly as an online business where some links that I share are affiliate links, and if anybody bought anything by clicking those links, I will get a commission based on that successful sale, which of course will not affect the price at which you are buying the product or service.
For more detailed information on my affiliate disclosure, please refer to the Full Affiliate Disclosure page.
This blog is also part of my blogging learning project. I’m using a platform to learn this part. If you are interested in it, it is called Wealthy Affiliate.
Furthermore, this site is in no way or form giving any financial or investing advice, nor is it encouraging or discouraging people to buy or sell any financial instrument. This is a personal diary in which I track my own progress and share it for informational, educational, and entertainment purposes.